muhd_nihal
The trade is against the trend Hence, a bit risky
In downtrend, Formed lower top, retraced to 61.8% CBSL 212 No targets, lets trail SL till it hits, Entry below PDL
Although the breakout has happened, Enter only above 136 (Above current swing high)
Entry above 319 SL 291 Target 372
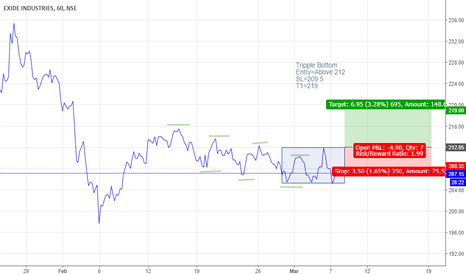
Please check chart for details... NB:For educational purpose only. Kindly consult your financial adviser before taking any trading decisions
Please check chart for details... NB:For educational purpose only. Kindly consult your financial adviser before taking any trading decisions
Please check chart for details... NB:For educational purpose only. Kindly consult your financial adviser before taking any trading decisions
Please check chart for details... NB:For educational purpose only. Kindly consult your financial adviser before taking any trading decisions
Enter above 610 on feb 14th or if the blue trend level is broken.
Please check chart for details... NB:For educational purpose only. Kindly consult your financial adviser before taking any trading decisions
Pls check chart for details. NB: For educational purpose only. Kindly consult your financial adviser before taking any trading decisions.
Pls check chart for details... NB:For educational purpose only. Kindly consult your financial adviser before taking any trading decisions
Pls Check charts for details.... NB:Educational Purpose Only. Consult your financial adviser before taking any trading decisions.
The script has retraced to 61.8% and taking a support here for past week. It has also formed a descending channel after the bull run, forming bullish flag. Considering last 10 days, it is forming an ascending triangle. Breaking above the upper boundary of the channel + Upper boundary of ascending triangle, chances are that the script will resume its bull run to...
I think this gives a much more fair idea of the 3800-4600 range we discussed


