Looks like a head and shoulder pattern is formed Breakdown will be confirmed below 10033
See the hammer on chart Also note Stochastic K line almost crossing D line Watch price action for few days Looks like a weak flag pattern too - vertical line + rectangle
Details on the chart, it's very interesting. Draw a triangle for the previous bull rally, copy & paste it on the current bull rally. It fits perfectly. The previous bull rally from Feb 2014 to March 2015 took 393 days and NIFTY went up by 3185 points. The recent bull rally from Dec 2016 to Jan 2018 took 399 days and NIFTY went up by 3277 points. The correction...
As seen in chart, a wedge is formed and stochastic is rising but price is falling - classic bullish divergence
Double bottom has been spotted, as seen in the chart Also recently the price has broke off the resistance level. Target 771 SL 738
Looks like a bearish flag For bullish flag the flag pole should be sharp rise.
Looks like a bearish flag has formed, because previously it failed to continue the rally after breaking out of the neckline of the rounded bottom Also flag is forming after a small correction in the upward direction, which means there's room for more downside.
Dmart appears to have had a high, then a pullback and now it's on the way to breakout Watch closely, probably a good buy above 1387
Just for study purpose! Measuring the ratio of MA difference and the length of correction and trying to predict what will be the price before bull starts again? May be 9288-9300 Based on previous MA cross and length of correction gap between 20 week and 200 week MA / length of correction = ratio 2305 / 1768 = 1.3 1199 / 676 = 1.77 average = 1.535 1859 / x =...
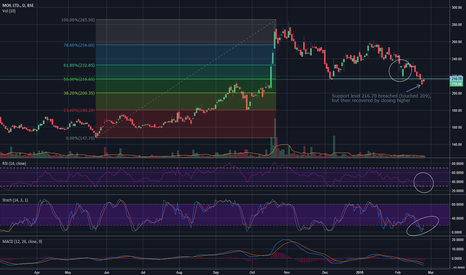
Doji was formed in downtrend followed by a bullish day and now it has formed inverted hammer on 1st March Also stochastic almost crossed red line (D)
Sell your positions or book loss, this is evening star formation and we can expect some correction now because 27 Feb - long green candle 28 Feb - spinning top (indecision) 29 Feb - red candle and closed below half of the green candle Stochastic K line (green) crossed below D line (red) RSI turned direction
The trend seems to be forming a inverse H&S (see circle - marks what looks like a left shoulder) Additional bullish evidence: RSI is rising Stochastic showing bullish 50% Fibonacci retracement is complete For better confirmation must wait for 2-3 days more to confirm bullish trend
We have a rounded top and a double bottom Can't really decide if this is a bull or bear, will depend on next few days trend


