USDINR looks like a bottom fishing candidate. Current rally has initiated after retesting the 50% Fibonacci retracement level.
1) According to Dow Theory, unless Nifty make a lower high and violates the prior higher low (9,700), bull trend is still intact. Lets study the current signs in more detail, --> Violated the short term uptrend support line --> Double top formation --> Negative divergence on RSI --> Retested the upper end of the long term rising channel According to Fibonacci...
The stock is retesting the down-trending trendline and is also retesting the 89-day (low) band. The 89-day (high-low) band is one of the most reliable moving average technique, although there is no documentation about it. The stock has rallied approx. 20%-25% from its recent lows. Do share your views about the same!
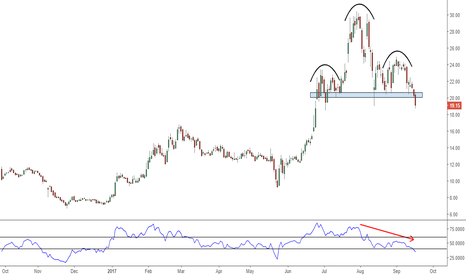
H&S top and RSI showing negative strength. Suggested to buy at Rs.12 earlier, see link below!
It can be a potential buy for the reasons mentioned in the chart! Double bottom confirmed by high volume and bollinger band breakout! Trendline break can lead a new leg higher.
Retesting the major support levels0
Rounding bottom breakout on hourly timeframe! Targets - 272 --> 285 Stoploss - 255
Measured price objective of 1450 with a stoploss of 1100
Targets - 710 --> 760 Stoploss - 635 Previously suggested at Rs. 290, see link below!
Inverted head and shoulder breakout, followed by a flag breakout. Target - 425-435
The stock is taking support of the trendline. Wait for a breakout up/down.
A potential Inverted H&S formation on daily chart and double bottom on the weekly chart.
The stock is approaching its major support after breaking out from the consolidation range. Add to positions on a confirmation of support.
Hello, What do you think guys? Is anticipation of patterns worth it? Or the best way is to just act when the signal occurs? Lets have a discussion on it!
The index has reversed a downtrend by breaking out from a declining channel. The 50-day MA (long term) has managed to cross above the 20-day MA (short term) confirming the Golden Crossover of the moving averages. I believe that the downtrend is now over and a new leg higher is now unfolding.
A topside breakout of the inverted H&S neckline will confirm the pattern. Will it break on the topside and subsequently recapture the Trendline as well? Wait and watch.


