utkarsh1979
There is breakout in Petronet on daily chart. Target - 279 SL - 259
It has already broke the 50 & 100 MA, if it further breaks the bottom trendline then it would fall to 1368 possibly Horizonal support lines are mentioned on the chart
If it break the trendline above then it would reach 3500 levels
There is breakout in RECT Ltd on daily chart. Next targets could be 155,167. Trading above 50 & 200 EMA.
There is breakout on weekly chart of Bajaj Auto. Also it just cross 50 & 200 EMA at the same time, both of them are strong support. Support & Resistance marked on the chart
There is Breakout in BEL on daily chart. Crossed above 50 & 200 EMA Next target 114-117
Breakout in BATA India on daily time frame. There was breakout and then last kiss and moved up. Next Targets could be 1553, 1579, 1606, 1644 Before achieving these targets it might retrace to previous supports (marked on the chart), then there would good buying opportunities.
Breakout and last kiss in Britannia on daily time frame and it just crossed 50 days moving average It can move further till next resistance
There is Breakout in ITDC on weekly time frame. Resistance are marked on the chart those could be the possible targets
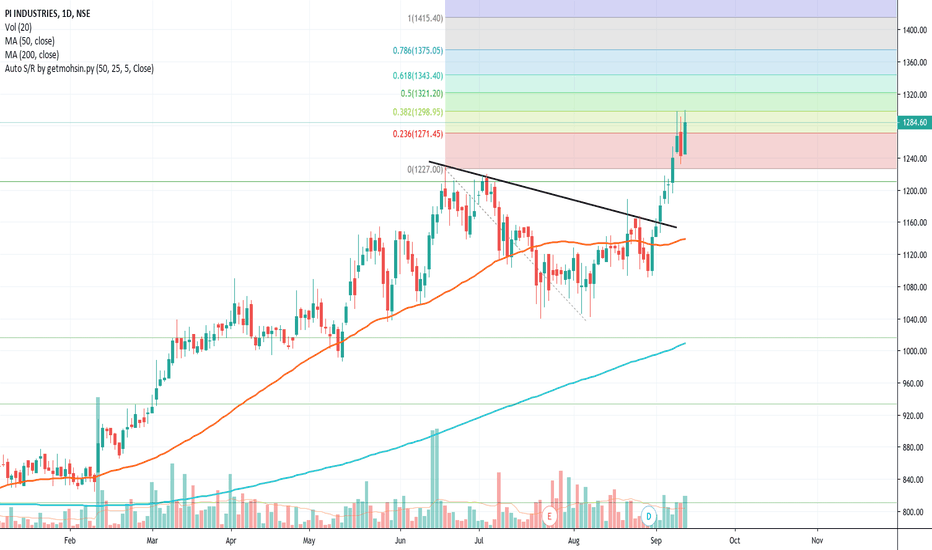
There is breakout in PIIND There might be some retracement at this all time high level. Once it crosses its all time high, it can go further up and achieve the target as per show on the chart by Fibonacci tool
There is opportunity to buy Jubilant food.
On weekly chart if it crosses above 2842 which is high of previous swing then there would be breakout. Also it is at 50 days EMA on weekly chart.
Breakout in Century Textile on daily time frame Resistance mentioned on the chart which would be the next target
Hindalco - possible breakout if crosses above trendline. Resistance mentioned in the chart which are previous swing high
Uptrend in Hindpetro. Trading above 50 & 200 EMA Crossed above the trend line
698 is strong support for RAMCO CEMENT from long time. There was trend reversal from this level many time. Right now there is breakout on daily chart Above 200 EMA & at 50 EMA.
Prestige Estate is in uptrend on the Monthly/Weekly chart Higher high and higher low formation on Monthly/Weekly chart Sooner it would break the previous swing high in coming months. Next target mentioned on chart as resistance
Breakout in BPCL on daily time frame with good volume It is at the 50 MA and below 200 MA, but close to 200 MA, if it crosses 50 & 200 MA then it would jump further high. Possible supports & resistances marked on the chart


