Dear friends, make your own trading plan. My analysis is like a tool which helps you. Trading is your own responsibility and follow your trading plan always. Buy above 493 with the stoploss of 490. Targets are 497, 500 and 502. Sell below 490 with the stoploss of 493. Targets are 487, 484 and 480. Trading rules.for "Vanathi Waves" 1. Enter trade after seeing price...
Triangles... triangles... fascinating triangles. I expect the price to fall, but my expectation doesn't matter. The important thing is trading plan. So as usual we are going to analyse and find entries for both long and short. Sell below 9870 with the stoploss of 9900. Targets are 9830 and 9780. Buy above 9910 with the stoploss of 9880. Targets are 9940 and 9960. ...
Quiz Time : What is this pattern called? a. W shape bottom b. boat pattern c. irregular rounding bottom. Feel free to answer :) Whatever the pattern is, price action is moving upside breaking the resistance at 466 - 470 levels. Above 475 is entry provided price shouldnt break 470. Targets are 485 and 495. Please share your views.
Yesbank and the rectangle formation looks interesting with the stochastic.When the price is consolidating inside the rectagle, stochastic reaching the lower band implies price will move up. More the consolidation, the break out will have good run. I expect the stock will make new high after forming, breaking the consolidation.
This stock is gaining steady growth and has taken support at 0.618 fib level. Aggressive investors should have entered at 95 level. Conservative investors can enter when the price breaks 0.786 fib level which is 107.I expect the stock to gain another 40 to 45 points in one year. Always consult your financial manager before investing.
Price action is trending near the resistance at 622 - 628 level unable to break it. Pattern formation is rounding bottom. If it forms a handle price will fall to 520 - 530 level. Price action will tell whether it is cup and handle or rounding bottom pattern soon.
My favourite triangle formation in price action as well as in RSI indicator :) Can invest when the price action breaks the triangle and closes above 104 for the targets 120, 150 and 160. Always consult your financial manager before investing.Time duration is one to one and half years.
Price action is consolidating inside a triangle. Buy above 837 with the stoploss of 833. Targets are 842, 846 and 850. Sell below 833 with the stoploss of 837. Targets are 829, 825 ans 823.
After a long time I am writing about "price action is forming a line". My favourite Dow tenet :) Will see how it works. Buy above 1295 with the stoploss of 1280. Targets are 1320, 1345 and 1370. Sell below 1280 with the stoploss of 1292. Targets are 1255, 1225 and 1200.
Buy above 24180 with the stoploss of 24140. Targets are 24230, 24270 and 24300. Sell below 24130 with the stoploss of 24170. Targets are 24070, 24020 and 23970.
Triangle breakout continues. Buy above 9895 with the stoploss of 9875. Targets are 9915, 9935 and 9950. Sell below 9875 with the stoploss of 9895. Targets are 9850 and 9820.
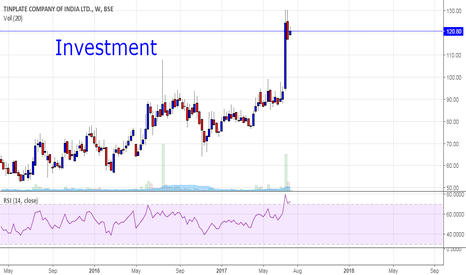
Price action has broken the long term resistance at 105 with high volume and closed above it, indicating positive upmove. Can buy the stock during pullback above 105 for the target 130 and 145. Duration is six months to one year. Always consult your financial manager before investing.
Price action has broken the long term resistance at 107 with volume indicating strength. Buy above 110 for the targets 140, 160 and 175. Investment strategy here is buy in dips. Duration is one to one and half years. Always consult your financial manager before investment.
Buy above 666 with the stoploss of 661. Targets are 671, 676 and 681. Sell below 661 with the stoploss of 666. Targets are 656, 651 and 645. Trading rules.for "Vanathi Waves" 1. Enter trade after seeing price action for 15 mins. 2. If you are bullish wait for the price action to give entry for long. 3. If you are bearish , wait for the price action to give entry...
Nifty has formed a descending triangle. Sell below 9830 with the stoploss of 9850. Targets are 9800 and 9780. Buy above 9850 with the stoploss of 9830. Targets are 9870, 9890 and 9910.
Buy above 24030 with the stoploss of 24000. Targets are 24110, 24170 and 24220. Sell below 24000 with the stoploss of 24030. Targets are 23920, 23870 and 23840.
Buy above 323 with the stoploss of 320. Targets are 324, 327 and 329. Sell below 318 with the stoploss of 321. Targets are 314, 312 and 309. Trading rules.for "Vanathi Waves" 1. Enter trade after seeing price action for 15 mins. 2. If you are bullish wait for the price action to give entry for long. 3. If you are bearish , wait for the price action to give entry...
Price action is trending inside the channel and now nearing the lower band of the channel. Trend line support is seen at 285. Closing below the support zone 285 - 281 will make the price to move towards 278, 265, 258 and 254. If price takes support and bounce back from lower channel /trend line support, it will make the price to move towards 315 and 335.


