📈  AAPL Weekly Chart Update
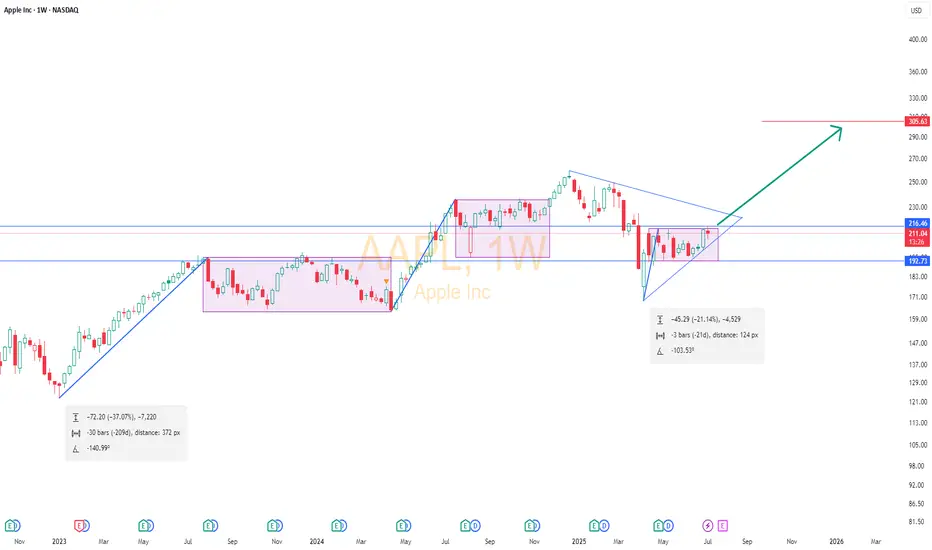
Apple is forming its third bullish flag since Jan 2023.
🔹 Flags:
1️⃣ Jan 2023 – Feb 2024
2️⃣ May 2024 – Mar 2025
3️⃣ Ongoing since Apr 2025
🔺 A triangle formation from Dec 2024 to Apr 2025 low is also converging.
💥 Breakout level: Weekly close above $216
📉 Stop Loss: $193 (weekly close)
🎯 Target: $305 in coming weeks
Technicals point to a strong bullish setup. Keep it on watch!
#AAPL #Apple #StockMarket #ChartAnalysis #TradingView
Disclaimer
The information and publications are not meant to be, and do not constitute, financial, investment, trading, or other types of advice or recommendations supplied or endorsed by TradingView. Read more in the Terms of Use.
Disclaimer
The information and publications are not meant to be, and do not constitute, financial, investment, trading, or other types of advice or recommendations supplied or endorsed by TradingView. Read more in the Terms of Use.