Trianglepattren

triangle breakout Borosil Renewables has given a breakout through a falling trendline and also triangle.
the breakout is with good volume. we can see short term and long term momentum is good in the stock and buyers interest can be seen rising. With the R:R of 1:3 the trade seems good.

SKP = Breakout but Low Volume StockPrice consolidate since August 2023 and it breakout the triangle today with good percentage. Only draw back is it is low volume stock and there is possibility for cicuit.

Solana Next Target is 202, 251 USD.. Triangle Pattern BreakoutSolana has formed a Triangle Pattern and Breakout, with the Next Target at 202 USD and a Final Target of 251 USD. Take advantage of this Great Opportunity to Earn a Potential Profit of +45% ROI and Overall +74%ROI. Check my Previous Analysis below, already reached the first Target at 174 USD with (+20% Profit).
This is a Long-Term Analysis, it's important to follow Trend continuation techniques.
I want to help People Make Profit all over the World.
PREVIOUS ANALYSIS : Before & After,

A triangle breakout in MapmyindiaNSE:MAPMYINDIA Triangle breakout is about to happen after being in consolidation for 170 days.
A target of 2300-2600 can be achieved with the SL of the recent swing of 1970.

Morgan Stanley: Triangle Pattern Target is 132 USD, Gain +23%At Morgan Stanley, a triangle pattern has formed, and there was a breakout above the pattern. There’s still a chance to gain a +23% profit, with a target of 132 USD.

TIILTIIL gave a breakout from a triangle. Enter with limited qty and add rest after a confirmation. Recently the company declared the buyback and I feel it has some big returns to offer.
NOTE: I'm not a SEBI REG. Study before investing.

BankNifty -E Wave or Explosive Wave - 1000+ Point RallyAs we discussed in the last idea .... Magical support zone gave us 1000+ point rally so far -which is part of Wave-E as per Elliott Wave Triangle
#elliottwave #waveanalysis #endingdiagonal #fallingwedge #trianglecorrection #trianglewave #correctivewaves
WaveTalks Snapshot
Last Idea - Elliott Wave Triangle: The Black 2024 Effect
Regards,
WaveTalks
Abhishek

ACC expecting wave E up for triangle formation ACC expecting wave E up for triangle formation
moving inside the channel and if breaks and gives a strong closing above
middle line of the channel than expecting to move p.
it has support zone 2220-2150
and today it bounced from the support zone and done wave D
and now expecting it to move for wave E formation
towards 2340--2375 in short term.
Disclaimer : I am not SEBI registered.

CHOLAFIN - Breakout and retestCHOLAFIN - Breakout and retest in Daily timeframe. The company has been in uptrend and the trend is likely to continue. I see a good upside potential/ Swing trading opportunity in this stock. There is a good entry point now with a very good R:R.
The company has very good fundamentals and has been a consistent good performer.
Note: These are my personal views only. Please conduct your own research before making a buy/ sell decision.

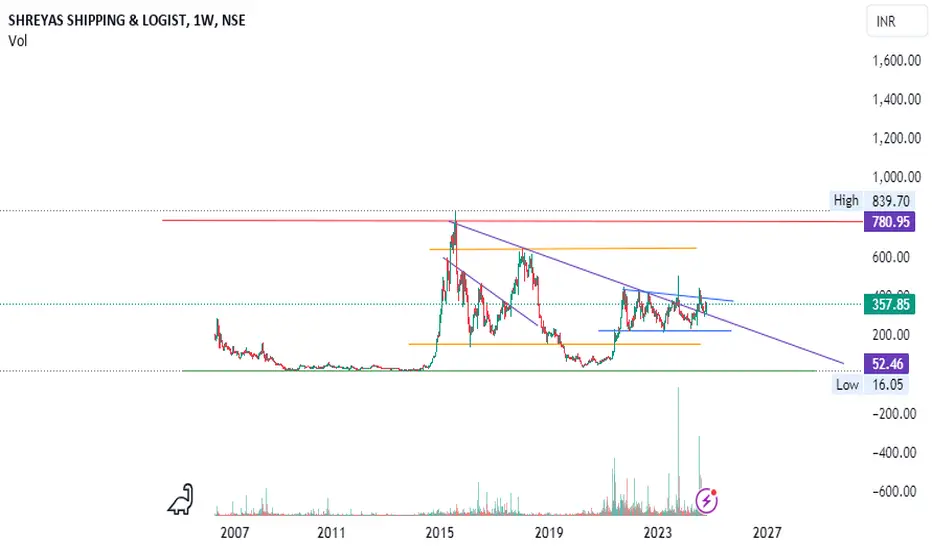
SHREYAS - Stock in RADARPrice consolidate (Channel) from 2021 with good volume. The stock also have high volume two times during breakout in day timeframe. Also, the price breakout the triangle like structure from 2015. If it breaks parallel channel in weekly timeframe we can expect target 640 Rs.
Advanced Info Service, Triangle Pattern Target, Gain +20% PROFITAdvanced Info Service, Triangle Pattern formed and Breakout above the Pattern. So the Next Target is 333 THB. Offering a Potential Profit of +20% ROI. Can you Guess the "Second Target"???.
I want to help People to Make Profit all over the "World".

SCB X PCL, Triangle Pattern Target & Gain +33% PROFITIn SCB X PCL, a Triangle Pattern has formed, and the market is expecting a breakout above the pattern. If the market breaks out above the Triangle Pattern, it is likely to reach the pattern target or the 0.618 Fibonacci retracement level at 146 THB. Take advantage of this Great Opportunity to Earn a Potential Profit of +33% ROI.
I want to help People to Make Profit all over the "World".

Citic Limited : Triangle Pattern Breakout & Target is 16.88 HKDIn Citic Limited, a Triangle Pattern has formed, and a Breakout above the pattern, indicating a potential Bullish Trend. The Target is 16.88 HKD, with a Potential Profit of +84%. This is a long-term Analysis, and trend continuation techniques should be followed.
I want to help people to Make Profit all over the "World".

SAKHTISUGSAKHTISUG - market fall but stock stand positive
Hello traders,
As always, simple and neat charts so everyone can understand and not make it too complicated.
rest details mentioned in the chart.
will be posting more such ideas like this. Until that, like share and follow :)
check my other ideas to get to know about all the successful trades based on price action.
Thanks,
Ajay.
keep learning and keep earning.

Crude Oil, Triangle Pattern forming and Target, Achieve +12% ROIA Triangle Pattern is forming in Crude Oil, with a Target at the Top of the Pattern and a potential to Achieve a +12% ROI. This is Long-Term Analysis, must follow the Trend continuation technique.

IOCIOC - Need to Break the range for move upside
Hello traders,
As always, simple and neat charts so everyone can understand and not make it too complicated.
rest details mentioned in the chart.
will be posting more such ideas like this. Until that, like share and follow :)
check my other ideas to get to know about all the successful trades based on price action.
Thanks,
Ajay.
keep learning and keep earning.

BabyDoge : Triangle Pattern forming and Target BabyDoge is forming a Triangle Pattern. The first Target is the Top of the Triangle, and a Breakout of the pattern is expected.

Ascending Triangle formationAscending Triangle formation as well as Symmetrical Triangle Formation seen in L&T. Also it has been in consolidation since January, 2024. Most Probably it will give a strong Breakout very Soon.

Triangle Pattern BreakoutThe stock has broken a 7 year Triangle with 6x volumes and has been in consolidation since 2 months. Can accumulate between 223-253 for a long term target of 434/940.

BTCUSD (CRYPTO) buy on dipsBTCUSD made All Time High 73805 on 14th March 2024
post that made low till now is 49112 on 5th Aug 2024
corrected nearly for 5 months.
Elliott Wave Analysis :
BTCUSD in Triple correction namely w-x-y-x-z
of which last leg is in progress... till now low made 49112.
Expecting wave z to form Triangle Pattern.
Indicator :
MACD given Positive Diversion and Positive cross over.
Important support :
Channel support near 53000
psychological level and low 49112
Worst case expected low : 45000
Improtant Fibonacci level :
0.618 % : 58430 (Acting as immediate resistance)
Buying opportunity :
Conservative approach: Buy on crossing 0-b trendline and sustaining above golden fib 58430
Aggressive approach : accumulate slowly near 45000-58430
Upside Potentials:
73000++ in long term
Conclusion : Be cautious now in shorting BTCUSD. Now time to look for buying opportunity in dips.
Disclaimer : Study here presented only for Educational purpose... No Trading advise..

SBICARD triangle breakoutSBICARD given triangle breakout in day timeframe
and also need triangle breakout with weekly close.
Immediate target expected 850-900 in short term
in log term post breakout expected to move 1100+
Disclaimer : I am not SEBI registered.. study is only for educational purpose

Hindustan Aeronautics Ltd, HAL.. breakoutHAL took the support near golden ratio 4599
and also given triangle breakout.
Positive move expected towards 5020 and than 5500++
Disclaimer L study is only for learning purpose
