Hello everyone, I’m Cryptorphic.
For the past seven years, I’ve been sharing insightful charts and analysis.
Follow me for:
~ Unbiased analyses on trending altcoins.
~ Identifying altcoins with 10x-50x potential.
~ Futures trade setups.
~ Daily updates on Bitcoin and Ethereum.
~ High time frame (HTF) market bottom and top calls.
~ Short-term market movements.
~ Charts supported by critical fundamentals.
Now, let’s dive into this chart analysis:
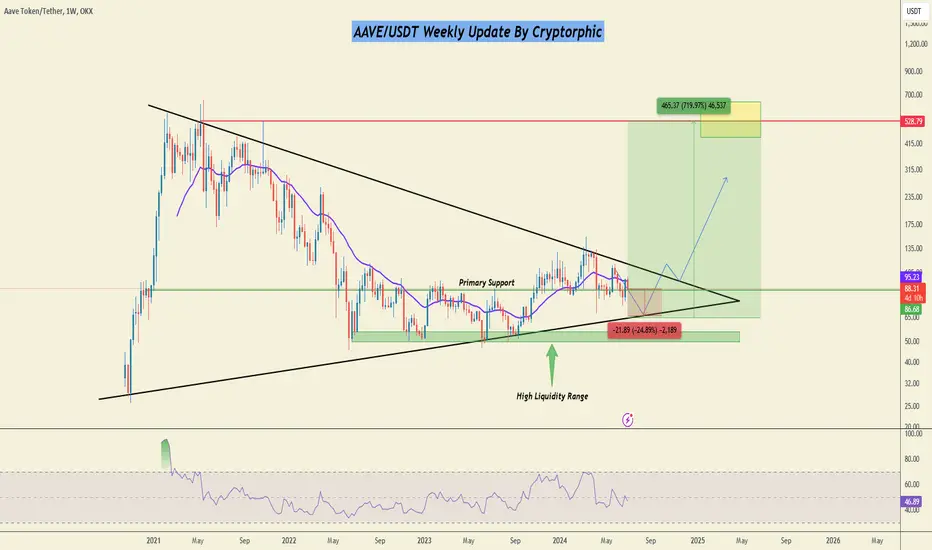
The AAVE/USDT weekly chart depicts a descending triangle pattern, which is typically a bearish continuation pattern. The current price is trading below the moving average, indicating a bearish trend. The RSI is neutral to slightly bearish.
If the price breaks below the horizontal support, a further decline to $65 could be anticipated. Conversely, a breakout above the downtrend resistance line could see the price targeting $530, representing a substantial potential upside in the upcoming bull run.
Key Observation:
~ Primary Support: $80 to $88.
~ Lower Support/Entry: $65.
~ High Liquidity Range: $50 to $55.
~ Resistance: $100.
~ Possible Rally: $240, $335, $412, $530.
DYOR. NFA.
Please hit the like button to support my content and share your thoughts in the comment section. Feel free to request any chart analysis you’d like to see!
Thank you!
#PEACE
For the past seven years, I’ve been sharing insightful charts and analysis.
Follow me for:
~ Unbiased analyses on trending altcoins.
~ Identifying altcoins with 10x-50x potential.
~ Futures trade setups.
~ Daily updates on Bitcoin and Ethereum.
~ High time frame (HTF) market bottom and top calls.
~ Short-term market movements.
~ Charts supported by critical fundamentals.
Now, let’s dive into this chart analysis:
The AAVE/USDT weekly chart depicts a descending triangle pattern, which is typically a bearish continuation pattern. The current price is trading below the moving average, indicating a bearish trend. The RSI is neutral to slightly bearish.
If the price breaks below the horizontal support, a further decline to $65 could be anticipated. Conversely, a breakout above the downtrend resistance line could see the price targeting $530, representing a substantial potential upside in the upcoming bull run.
Key Observation:
~ Primary Support: $80 to $88.
~ Lower Support/Entry: $65.
~ High Liquidity Range: $50 to $55.
~ Resistance: $100.
~ Possible Rally: $240, $335, $412, $530.
DYOR. NFA.
Please hit the like button to support my content and share your thoughts in the comment section. Feel free to request any chart analysis you’d like to see!
Thank you!
#PEACE
Daily Signals:- telegram.me/thecryptorphic
Best Exchange BITUNIX: bit.ly/JoinCryptorphic
BLOFIN - bit.ly/Cryptorphic
Binance: bit.ly/cryptorphic1000
ELITES: bit.ly/Join_elite
Best Exchange BITUNIX: bit.ly/JoinCryptorphic
BLOFIN - bit.ly/Cryptorphic
Binance: bit.ly/cryptorphic1000
ELITES: bit.ly/Join_elite
Related publications
Disclaimer
The information and publications are not meant to be, and do not constitute, financial, investment, trading, or other types of advice or recommendations supplied or endorsed by TradingView. Read more in the Terms of Use.