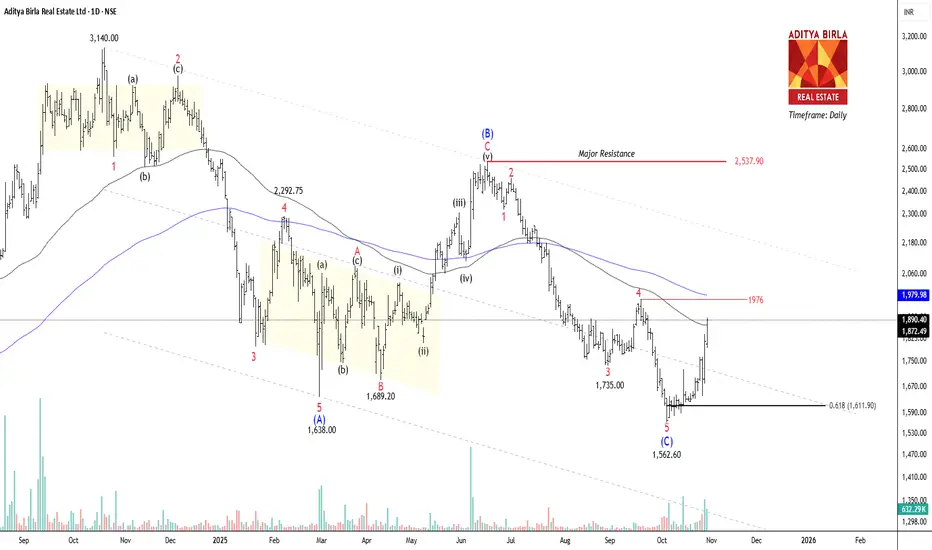
NSE ABREL has constructed a corrective A-B-C formation on the daily timeframe chart. The price has fallen 50% from the all-time high of 3410 within 13 months. Wave (B) occurred at 2537.9, where Wave (c) completed the 5-wave cycle at 1635. If the price breaks and closes above 1976, traders can buy for the following targets: 2080 – 2140 – 2185+.
Why can’t we label it early?
We can assume wave (C) is 100% agreed upon without any confirmation. It can be a huge mistake if the price falls below 1880 again; this could signal a complex corrective extension.
Our targets are up to the upper band only because the alternate count says this bounce might still be a wave 4. The move is sharp, but corrective wave 4 rallies often look impulsive.
The trend remains down until the channel is broken.
Important Factors:
Volume Analysis:
Volume on the latest bars is increasing, but not enough to scream “trend reversal”. We need a volume breakout, not just price.
Failure Zone:
Rejection at 1976 = Ugly pullback to 1730 -1700.
Invalidation:
Closing below the Fibonacci retracement 0.618 at 1611 will make this count invalid due to the formation of new lower lows.
Alternative count:
We will look for one more downward move of the ending diagonal (Wave E) before printing the bottom!
Disclaimer
The information and publications are not meant to be, and do not constitute, financial, investment, trading, or other types of advice or recommendations supplied or endorsed by TradingView. Read more in the Terms of Use.
Disclaimer
The information and publications are not meant to be, and do not constitute, financial, investment, trading, or other types of advice or recommendations supplied or endorsed by TradingView. Read more in the Terms of Use.