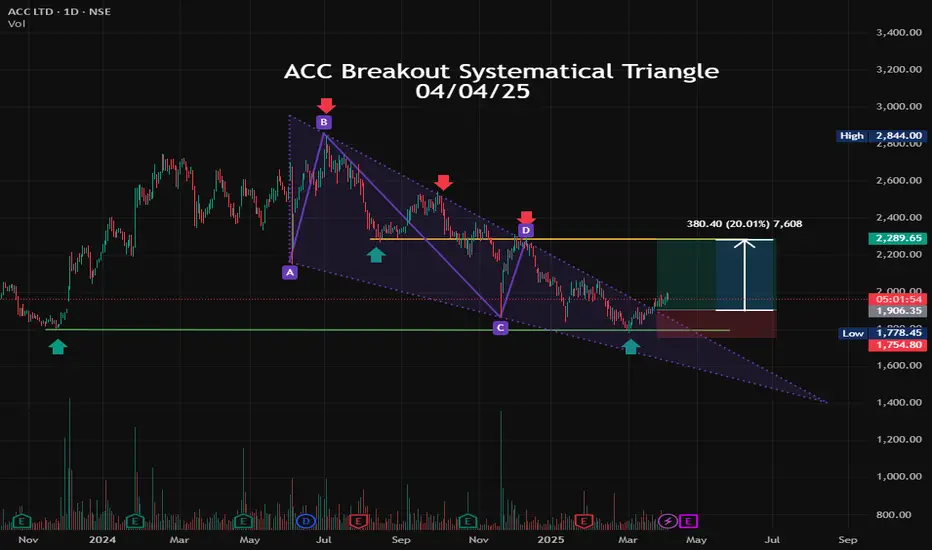
NSE INDIA, Symbol : ACC Timeframe : Daily. ACC systematical triangle start point A) 03/06/2024 first bottom B) Point b is life time high top 2855. C) Next lower low point D) Next higher high point I was drag this point to create systematical triangle. 25/3/2025 Acc breakout the triangle line and Acc last 1 week trade above the line. ACC return pull back in good support level. systematical triangle line breakout . It will be move up side 20% no any strong resistance then recommended target is 2290
mail Id : satyambeed@gmail.com
WhatsApp +919270007010
Telegram : @AI_Trend_My_Friend forms.gle/H5FUra2tFHn3WR8u6
WhatsApp +919270007010
Telegram : @AI_Trend_My_Friend forms.gle/H5FUra2tFHn3WR8u6
Disclaimer
The information and publications are not meant to be, and do not constitute, financial, investment, trading, or other types of advice or recommendations supplied or endorsed by TradingView. Read more in the Terms of Use.