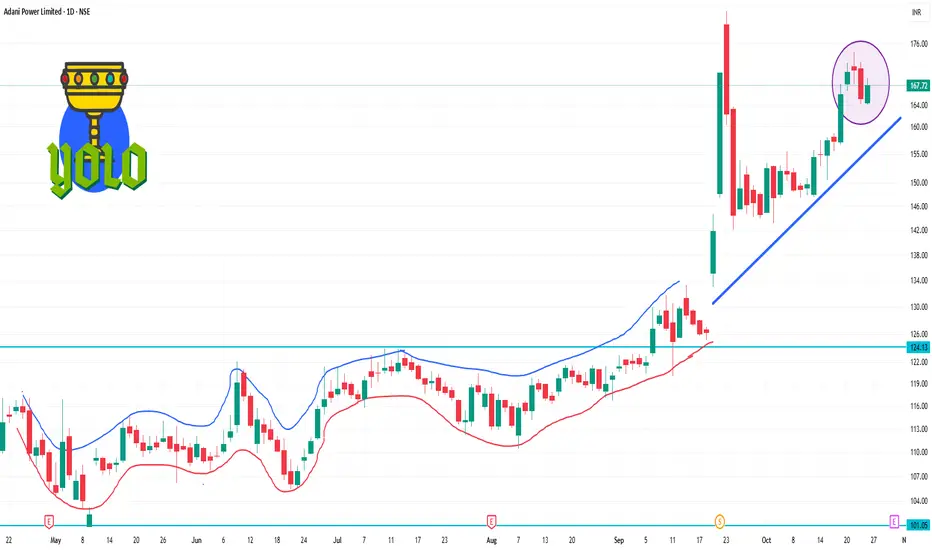
📊 Key Support & Resistance Levels
Resistance Levels: ₹168.81 (R3), ₹170.33 (R2), ₹175.40 (R1)
Support Levels: ₹154.11 (S4), ₹159.18 (S3), ₹162.22 (S2)
Pivot Point: ₹167.29
These levels are derived from standard, Fibonacci, and Camarilla pivot point analyses.
🔄 Moving Averages
5-Day EMA: ₹164.26 — bullish.
10-Day EMA: ₹157.77 — bullish.
20-Day EMA: ₹153.75 — bullish.
50-Day EMA: ₹136.09 — bullish.
100-Day EMA: ₹125.71 — bullish.
200-Day EMA: ₹114.92 — bullish.
The stock is trading above all major moving averages, reinforcing the bullish outlook.
Related publications
Disclaimer
The information and publications are not meant to be, and do not constitute, financial, investment, trading, or other types of advice or recommendations supplied or endorsed by TradingView. Read more in the Terms of Use.
Related publications
Disclaimer
The information and publications are not meant to be, and do not constitute, financial, investment, trading, or other types of advice or recommendations supplied or endorsed by TradingView. Read more in the Terms of Use.