ADANI POWER — NEUTRAL → LONG ON BREAKOUTCurrent: ₹208 | Weekly chart
Trend: Long-term bullish, but currently in a short-term consolidation/correction.
Key resistance: ₹213–215 — horizontal resistance + falling trendline.
Breakout trigger: Weekly close above ₹217.40 ✅
Targets: ₹230 → ₹250–255 → ₹280
Support: ₹200
Major support: ₹185 → ₹16
Compare with Adani Power Limited
7.39 INR
127.75 B INR
532.03 B INR
4.15 B
Next report date
—
Report period
—
EPS estimate
—
Revenue estimate
—
Company info
Sector
Industry
Website
Headquarters
Ahmedabad
Founded
1996
IPO date
Jul 28, 2009
ISIN
INE814H01029
FIGI
BBG000VHQ8Z3
Identifiers
ISIN INE814H01029
Adani Power Ltd. is a thermal power producer, engages in the generation and transmission of electricity under long term power purchase agreements and on merchant basis in India. It generates electricity through thermal and solar energy sources. The firm has various power projects at Mundra, Gujarat, Tiroda, Maharashtra, Udupi, Karnataka. It also trades in coal. The company was founded on August 22, 1996 and is headquartered in Ahmedabad, India.
Adani Power — Technical AnalysisOverall view
Current bias: 🟢 Mildly bullish
The stock is in a consolidation phase after a strong earlier rally.
The broader trend remains positive, but the stock needs to cross ₹216–₹220 convincingly to resume a stronger upward move.
The most important downside level is ₹200.
Current price a
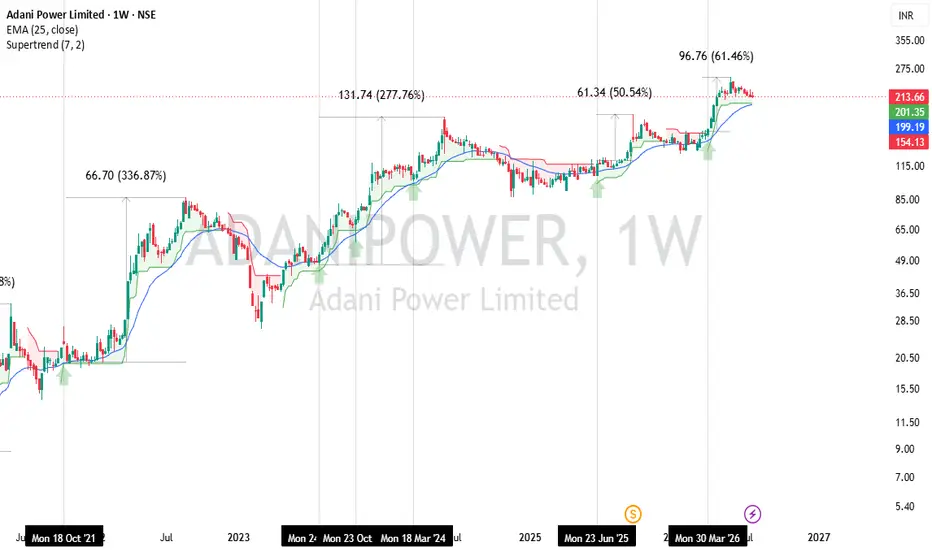
Mastering Swing Trades: High-Probability Weekly SetupLooking to avoid the constant noise and false signals of lower timeframes?
A weekly timeframe strategy allows you to capture clean 25% to 300% swing moves while trading stress-free..
By combining a Supertrend (7, 2) indicator with a 25-Period Weekly Exponential Moving Average (25 WEMA), this high-c
Adani Power - It's HOTAdani Power is transitioning from a transition‑phase utility to a more structured, growth‑oriented thermal‑plus‑renewable power player. The last four quarters show improving execution, better capacity utilization, and a more stable revenue base, which is gradually lifting investor confidence in the
ADANI POWER – Strong Breakout Structure With Trendline Support 🟢 Simple Chart Explanation:
* ADANI POWER is showing a strong bullish structure on the 4H timeframe
* Price respected the rising trendline multiple times, showing strong buyer support
* Earlier resistance zone near ₹155 gave a clean breakout and started the strong rally
* Now price is again testing
ADANIPOWER: Flag & Pole Continuation Setup on Daily Chart“Bullish Flag setup under observation.
Breakout above 234 may initiate continuation toward 293 based on measured move projection.
Volume confirmation and candle close above resistance will be key for validation.
Invalidation below 194.”
“This analysis is for educational purposes only and not financi
See all ideas
Summarizing what the indicators are suggesting.
Neutral
Neutral
Neutral
An aggregate view of professional's ratings.
Neutral
Neutral
Neutral
Displays a symbol's price movements over previous years to identify recurring trends.
Frequently asked questions
The current price of ADANIPOWER is 196.94 INR — it has decreased by −2.70% in the past 24 hours. Watch Adani Power Limited stock price performance more closely on the chart.
Depending on the exchange, the stock ticker may vary. For instance, on NSE exchange Adani Power Limited stocks are traded under the ticker ADANIPOWER.
ADANIPOWER stock has fallen by −0.88% compared to the previous week, the month change is a −4.91% fall, over the last year Adani Power Limited has showed a 29.57% increase.
We've gathered analysts' opinions on Adani Power Limited future price: according to them, ADANIPOWER price has a max estimate of 282.00 INR and a min estimate of 220.00 INR. Watch ADANIPOWER chart and read a more detailed Adani Power Limited stock forecast: see what analysts think of Adani Power Limited and suggest that you do with its stocks.
ADANIPOWER reached its all-time high on May 29, 2026 with the price of 254.20 INR, and its all-time low was 3.03 INR and was reached on Jul 2, 2018. View more price dynamics on ADANIPOWER chart.
See other stocks reaching their highest and lowest prices.
ADANIPOWER stock is 3.80% volatile and has beta coefficient of 0.81. Track Adani Power Limited stock price on the chart and check out the list of the most volatile stocks — is Adani Power Limited there?
Today Adani Power Limited has the market capitalization of 3.89 T, it has decreased by −1.05% over the last week.
Yes, you can track Adani Power Limited financials in yearly and quarterly reports right on TradingView.
Adani Power Limited is going to release the next earnings report on Oct 23, 2026. Keep track of upcoming events with our Earnings Calendar.
ADANIPOWER earnings for the last quarter are 2.50 INR per share, whereas the estimation was 1.87 INR resulting in a 33.69% surprise. The estimated earnings for the next quarter are 1.79 INR per share. See more details about Adani Power Limited earnings.
Adani Power Limited revenue for the last quarter amounts to 175.50 B INR, despite the estimated figure of 161.32 B INR. In the next quarter, revenue is expected to reach 157.46 B INR.
ADANIPOWER net income for the last quarter is 48.06 B INR, while the quarter before that showed 40.17 B INR of net income which accounts for 0.00% change. Track more Adani Power Limited financial stats to get the full picture.
No, ADANIPOWER doesn't pay any dividends to its shareholders. But don't worry, we've prepared a list of high-dividend stocks for you.
As of Oct 8, 2026, the company has 25.63 K employees. See our rating of the largest employees — is Adani Power Limited on this list?
EBITDA measures a company's operating performance, its growth signifies an improvement in the efficiency of a company. Adani Power Limited EBITDA is 172.33 B INR, and current EBITDA margin is 35.80%. See more stats in Adani Power Limited financial statements.
Like other stocks, ADANIPOWER shares are traded on stock exchanges, e.g. Nasdaq, Nyse, Euronext, and the easiest way to buy them is through an online stock broker. To do this, you need to open an account and follow a broker's procedures, then start trading. You can trade Adani Power Limited stock right from TradingView charts — choose your broker and connect to your account.
Investing in stocks requires a comprehensive research: you should carefully study all the available data, e.g. company's financials, related news, and its technical analysis. So Adani Power Limited technincal analysis shows the sell today, and its 1 week rating is neutral. Since market conditions are prone to changes, it's worth looking a bit further into the future — according to the 1 month rating Adani Power Limited stock shows the buy signal. See more of Adani Power Limited technicals for a more comprehensive analysis.