### 🧾 **Chart Type & Time Frame**
* **Daily Candlestick Chart** (1D)
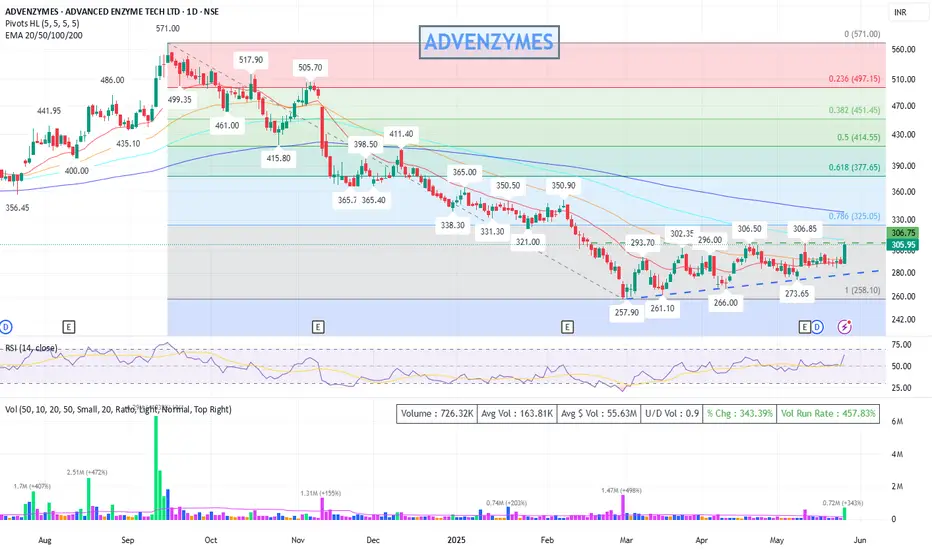
* **Exchange**: NSE (India)
* **Latest Price**: ₹305.95 (+6.12% on the day)
* **Volume**: 726.33K (well above average — **457.83%** Volume Run Rate)
---
### 📉 **Trend Analysis**
* **Primary Trend**: Downtrend from ₹517.90 (high in Nov 2024) to a bottom around ₹257.90 (March 2025).
* **Current Action**: Price is showing a **potential reversal** from a long downtrend.
* **Higher Lows Pattern**: Since the bottom at ₹257.90, price has made:
* ₹261.10 → ₹266.00 → ₹273.65 → ₹306.85 → (Now breaking above ₹306.75)
This forms an **ascending triangle** pattern (bullish bias).
---
### 📊 **Indicators & Overlays**
#### 1. **Moving Averages (EMA)**
* EMA levels:
* EMA-20: ₹290.07
* EMA-50: ₹292.01
* EMA-100: ₹310.17
* EMA-200: ₹337.89
**Current price (₹305.95)** is:
* Above EMA-20 & EMA-50 → Short-term bullish
* Slightly below EMA-100 and EMA-200 → Mid-to-long term resistance still ahead
If it breaks and sustains above EMA-100 & EMA-200, stronger uptrend confirmation.
---
#### 2. **Fibonacci Retracement (from ₹571 to ₹258)**
* **Key levels:**
* 23.6% → ₹497.15
* 38.2% → ₹451.45
* 50% → ₹414.55
* 61.8% → ₹377.65
* 78.6% → ₹325.05 *(Immediate target zone)*
**Price approaching 78.6% retracement (₹325.05)**, which is a key resistance zone. A breakout here can push prices towards ₹337-₹350 zone.
---
#### 3. **RSI (14, Close)**
* Current RSI: **\~62.90**
* Moving above the 60 level, indicating building bullish momentum.
* Still not overbought (>70), room for upward move exists.
---
#### 4. **Volume**
* Spike in volume on the breakout day → Strong confirmation.
* Today's volume: **726.33K** vs average 163.81K → Over **4x average**.
---
### 📌 **Support & Resistance Levels**
#### Key Resistance:
* ₹306.85 (recent swing high) → **Broken today**
* ₹325.05 (Fibo 78.6%)
* ₹337.89 (EMA-200)
* ₹350–365 (previous price clusters)
#### Key Support:
* ₹293–296 (previous resistance, now support)
* ₹273.65 (swing low)
* ₹258 (Fibo 100% level)
---
### 🔺 **Pattern Observed**
* **Ascending Triangle** breakout confirmed with high volume
* Bullish structure: Higher lows with flat resistance (₹306 zone)
* If price sustains above ₹306, could target ₹325–₹350 short term
---
### 🔮 **Conclusion & View**
✅ **Bullish Bias in Short Term**
* Breakout of important level with strong volume
* RSI supportive
* EMA crossovers may follow if trend continues
📈 **Short-Term Target**: ₹325 → ₹337 → ₹350
📉 **Stop Loss**: ₹293 or ₹280 (based on risk appetite)
📌 Disclaimer: This analysis is for educational and informational purposes only and does not constitute investment advice. Please do your own research or consult with a financial advisor before making any trading decisions. Markets are subject to risks.
Trade active
📈 **Short-Term Target Update**: ₹325(First Target Achieved) → ₹337 → ₹350📉 **Stop Loss**: ₹293 or ₹306 (Revise based on risk appetite)
Disclaimer
The information and publications are not meant to be, and do not constitute, financial, investment, trading, or other types of advice or recommendations supplied or endorsed by TradingView. Read more in the Terms of Use.
Disclaimer
The information and publications are not meant to be, and do not constitute, financial, investment, trading, or other types of advice or recommendations supplied or endorsed by TradingView. Read more in the Terms of Use.