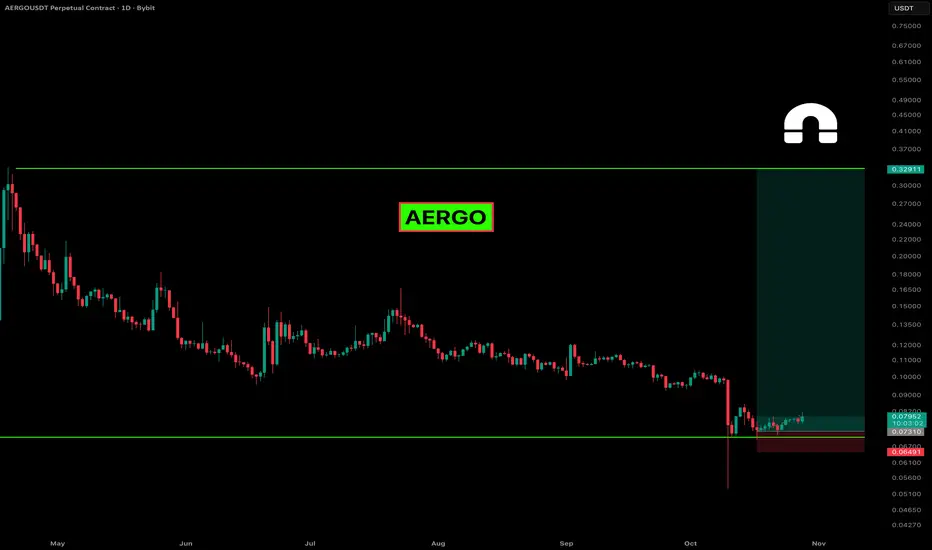
AERGO has been drifting lower for months, but price action seems to be stabilizing near a solid historical support zone around the $0.06–$0.07 range. After a sharp selloff earlier in October, the chart now shows early signs of accumulation — a small series of higher lows and tightening candles right above support. That’s usually where stronger hands start positioning before any larger move develops.
The weekly performance flipped slightly green (+3.5%), suggesting that selling pressure might finally be easing. On the daily chart, volume has picked up slightly, and the structure looks like it’s setting up for a potential relief rally if buyers can maintain momentum above this zone.
There’s plenty of room toward the upper range near $0.32 if a mid-term reversal plays out, but bulls still need confirmation through a clean breakout of the short-term consolidation.
Not financial advice, just watching how price reacts around this base. If it holds, it could turn into a solid recovery setup after months of decline.
Let’s see if buyers can defend this level and push AERGO into its next phase.
🚀🚀🚀AND DONT FORGET TO CHECK OUT MY PROFILE!
👉👉👉 I am using indicators from Risological.com
✅ Works on all markets
✅ 30-Day Money-Back Guarantee.
👉👉👉 CHECK IT OUT @ Risological.com
✅ Works on all markets
✅ 30-Day Money-Back Guarantee.
👉👉👉 CHECK IT OUT @ Risological.com
Related publications
Disclaimer
The information and publications are not meant to be, and do not constitute, financial, investment, trading, or other types of advice or recommendations supplied or endorsed by TradingView. Read more in the Terms of Use.