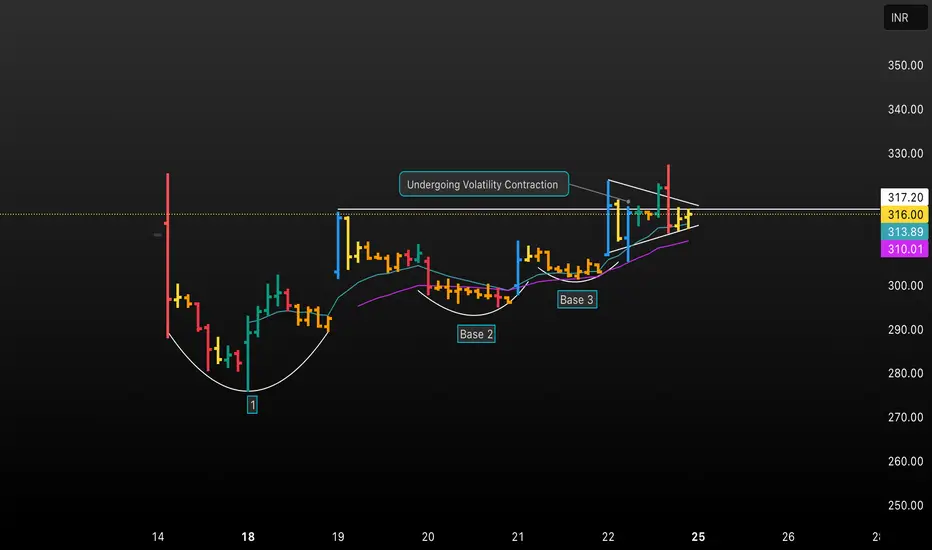
Unlock a detailed analysis of volatility contraction in this TradingView chart! Discover how price stabilizes through three distinct bases, undergoes steady consolidation, and prepares for a breakout. This educational chart highlights key phases, trendlines, and technical signals to help traders identify high-probability entry points using volatility contraction patterns. Ideal for those seeking actionable insights and trading strategy refinement.
Disclaimer
The information and publications are not meant to be, and do not constitute, financial, investment, trading, or other types of advice or recommendations supplied or endorsed by TradingView. Read more in the Terms of Use.
Disclaimer
The information and publications are not meant to be, and do not constitute, financial, investment, trading, or other types of advice or recommendations supplied or endorsed by TradingView. Read more in the Terms of Use.