🔎 Overview
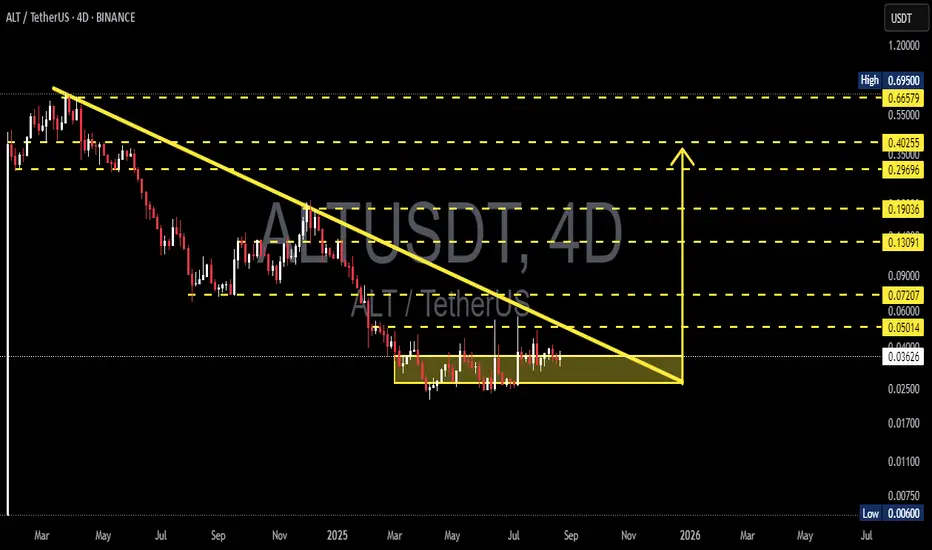
ALT/USDT has been in a prolonged downtrend since 2024, consistently forming lower highs along a descending trendline. At the same time, buyers continue to defend the support base at 0.028–0.031 USDT, creating a clear Descending Triangle pattern.
Currently, price action is consolidating inside a yellow accumulation box — squeezed between strong demand below and heavy supply above. This kind of compression often ends with a large expansion move, either a breakout or a breakdown.
---
🧩 Technical Structure
Main Pattern: Descending Triangle (typically bearish continuation, but at the end of long trends it can act as a reversal).
Key Demand Zone (support): 0.028–0.031
Key Supply Zone (resistance + trendline): 0.040–0.042
Major Resistance Levels:
0.050 → 0.060 → 0.072 → 0.090 → 0.131 → 0.190 → 0.270 → 0.403 → 0.666
Support Levels if Breakdown:
0.017 → 0.011 → 0.006
---
🚀 Bullish Scenario (Potential Reversal & Breakout)
1. Confirmation: 4D close above 0.042 and a clean breakout from the descending trendline.
2. Entry Trigger: Retest of 0.040–0.042 holding as new support.
3. Short- to Mid-Term Targets:
0.050 (minor resistance)
0.060 (psychological barrier)
0.072–0.090 (major supply zone)
4. Long-Term Targets (if momentum builds): 0.130 → 0.190 → 0.270
5. Invalidation: Price closes back below 0.038–0.040 after breakout.
---
📉 Bearish Scenario (Trend Continuation)
1. Confirmation: 4D close below 0.028 with strong volume.
2. Entry Trigger: Retest of 0.028–0.031 fails to reclaim (acting as resistance).
3. Targets to the Downside:
0.017 (historical support)
0.011 (extreme support)
0.006 (all-time low risk zone)
4. Invalidation: Price reclaims above 0.031 after breakdown.
---
⚖️ Key Notes
Price is in a compression phase — the longer it consolidates inside the box, the stronger the eventual breakout or breakdown.
Watch for false breakouts/breakdowns, especially around 0.028–0.042 key levels.
The 4D timeframe provides stronger confirmation signals; patience is key.
Always manage risk: maintain R:R ≥ 1:2, scale in/out across marked levels.
---
🎯 Conclusion
ALT/USDT is at a critical decision point: Will it break out of its long downtrend and start a bullish reversal, or will sellers dominate again and push the price to fresh lows?
The Descending Triangle acts like a “technical time bomb” — pressure keeps building, and once released, it could result in a significant move.
Traders should closely watch for a confirmed breakout above 0.042 (bullish) or a breakdown below 0.028 (bearish) to determine the next major direction.
#ALTUSDT #ALT #Crypto #CryptoAnalysis #PriceAction #DescendingTriangle #Breakout #SupportResistance
✅ Get Free Signals! Join Our Telegram Channel Here: t.me/TheCryptoNuclear
✅ Twitter: twitter.com/crypto_nuclear
✅ Join Bybit : partner.bybit.com/b/nuclearvip
✅ Benefits : Lifetime Trading Fee Discount -50%
✅ Twitter: twitter.com/crypto_nuclear
✅ Join Bybit : partner.bybit.com/b/nuclearvip
✅ Benefits : Lifetime Trading Fee Discount -50%
Disclaimer
The information and publications are not meant to be, and do not constitute, financial, investment, trading, or other types of advice or recommendations supplied or endorsed by TradingView. Read more in the Terms of Use.