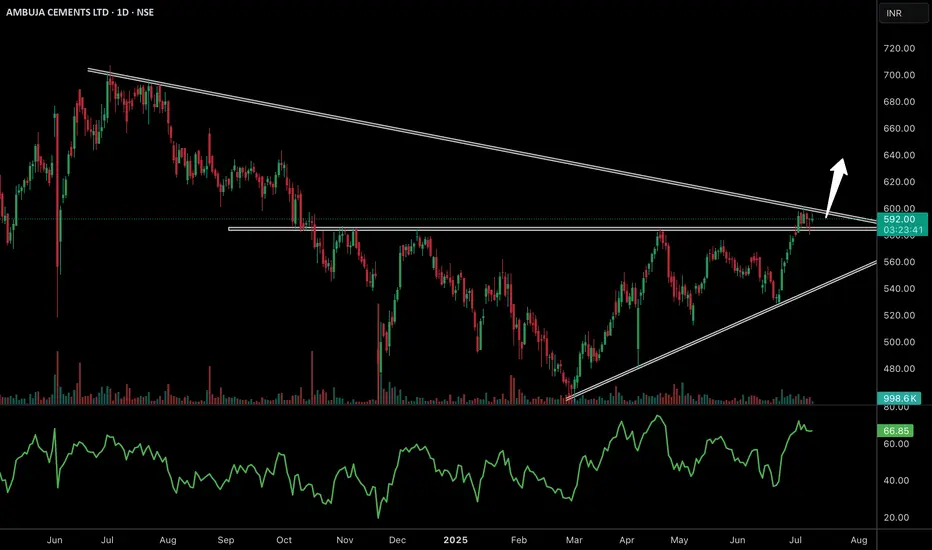
✅ Ambuja Cements is trading within a large symmetrical triangle on the daily chart and is now testing the upper trendline near 590–600, a key breakout zone that has acted as resistance multiple times.
✅ The stock is holding well above its previous horizontal resistance around 570, which now acts as a strong support base, indicating buyers are defending levels aggressively.
✅ RSI is near 66, showing good bullish momentum and plenty of room for further upside if a breakout occurs with strong volume.
✅ Volume remains steady; a clear surge above average during the breakout can trigger a sharp move towards the next resistance zone near 630–650.
📈 Watch for a sustained daily close above 600. If confirmed, Ambuja may see a fresh uptrend supported by strong fundamentals in the cement sector.
Join our community in telegram for real time updates --- telegram.me/marketiik
Telegram- telegram.me/marketiik
A simple trader, distancing from the fake crowd. Simplifying complexity, I prioritize genuine insights over trends.
Telegram- telegram.me/marketiik
A simple trader, distancing from the fake crowd. Simplifying complexity, I prioritize genuine insights over trends.
Disclaimer
The information and publications are not meant to be, and do not constitute, financial, investment, trading, or other types of advice or recommendations supplied or endorsed by TradingView. Read more in the Terms of Use.