🏢 Company Overview
Anant Raj Ltd is a leading real estate developer in India, focused on residential, commercial, and industrial infrastructure projects, primarily in the NCR. The company has consistently demonstrated strong execution, strategic land holdings, and diversified income streams.
📊 Fundamental Snapshot (FY 2023–24)
✅ Revenue & Profitability
✅ Balance Sheet Highlights
✅ Financial Ratios
🧭 Technical Analysis Overview
📌 Price Action & Pattern Formation
🔁 Reversal Zones
Confirmed Reversal Zone: ₹412.60 – ₹443.00
Price reacted positively from this area, aligning with both technical support and fundamental stability.
🔼 Resistance & Breakout Levels
🎯 Resistance Targets
💡 Investment Takeaway
Why it’s attractive now:
Strong fundamentals with improved profitability and reduced debt.
Price reversal from a key demand zone, forming a bullish wedge pattern.
Technically poised for a breakout if it sustains above ₹605.
Disclaimer: lnkd.in/gJJDnvn2
Anant Raj Ltd is a leading real estate developer in India, focused on residential, commercial, and industrial infrastructure projects, primarily in the NCR. The company has consistently demonstrated strong execution, strategic land holdings, and diversified income streams.
📊 Fundamental Snapshot (FY 2023–24)
✅ Revenue & Profitability
- Revenue: ₹1,961.91 Cr (+55% YoY)
- Net Profit: ₹385.23 Cr (+72.65% YoY)
- EPS: ₹11.27 (+68.29% YoY)
- Operating Margin: 64.24%
- Net Profit Margin: 19.64%
✅ Balance Sheet Highlights
- Net Worth: ₹3,404.38 Cr (+23.3% YoY)
- Total Assets: ₹4,051.55 Cr
- Debt-to-Equity: 0.17 (down from 0.37)
- Current Ratio: 5.38
✅ Financial Ratios
- ROE: 7.27%
- ROA: 3.26%
- Interest Coverage: 10.11
- P/E: 43.53
- P/B: 4.65
🧭 Technical Analysis Overview
📌 Price Action & Pattern Formation
- Anant Raj Ltd made an All-Time High (ATH) of ₹947.90 on January 8, 2025.
- Since then, the stock rejected 60.32% from its peak, confirming a low at ₹376.15 on April 7, 2025.
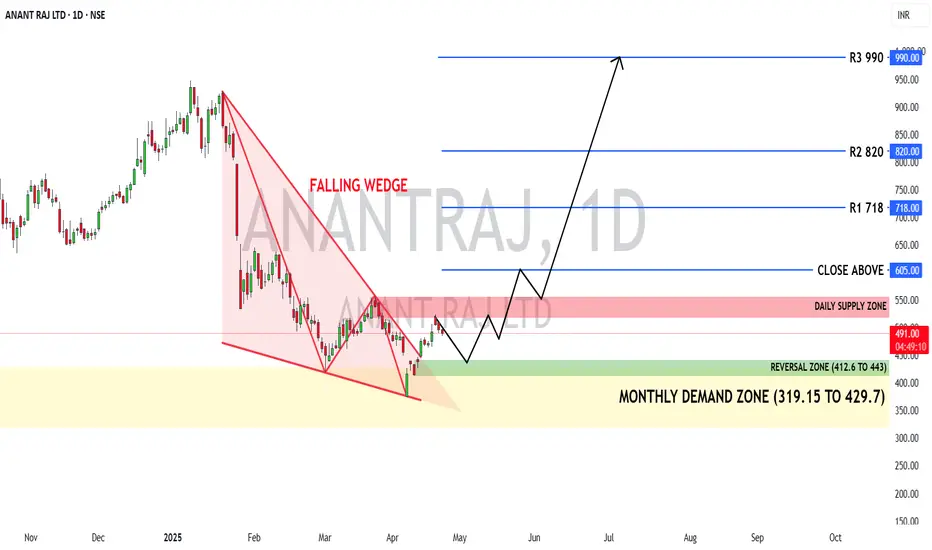
- The price structure has framed a Falling Wedge Pattern, a bullish reversal formation.
- Price tested the monthly demand zone between ₹319.15 – ₹429.70, indicating strong buyer interest and a potential bottom.
🔁 Reversal Zones
Confirmed Reversal Zone: ₹412.60 – ₹443.00
Price reacted positively from this area, aligning with both technical support and fundamental stability.
🔼 Resistance & Breakout Levels
- Daily Supply Zone: Price has now reached this overhead zone, which may lead to short-term consolidation.
- Breakout Confirmation: A daily/weekly close above ₹605 is key to validate a trend reversal and breakout from the falling wedge.
🎯 Resistance Targets
- R1: ₹718
- R2: ₹820
- R3: ₹990
💡 Investment Takeaway
Why it’s attractive now:
Strong fundamentals with improved profitability and reduced debt.
Price reversal from a key demand zone, forming a bullish wedge pattern.
Technically poised for a breakout if it sustains above ₹605.
Disclaimer: lnkd.in/gJJDnvn2
Disclaimer
The information and publications are not meant to be, and do not constitute, financial, investment, trading, or other types of advice or recommendations supplied or endorsed by TradingView. Read more in the Terms of Use.
Disclaimer
The information and publications are not meant to be, and do not constitute, financial, investment, trading, or other types of advice or recommendations supplied or endorsed by TradingView. Read more in the Terms of Use.