JUBLPHARMA Ready for an Up Move?Hello fellow traders, I hope you are all doing well.
Key Observations:
1. Strong Support Zone: JUBLPHARMA has reached a strong zone that previously acted as resistance and could now turn into support.
2. Chart Pattern: A falling wedge pattern is visible, which is typically a bullish reversal signal. We can also see that the breakout has already happened and now the price has come to retest.
3. Bullish Engulfing Candle: On the weekly time frame, we see buying pressure emerging, confirmed by a Bullish Engulfing candle.
4. Entry Point: A good entry could be above ₹1010 for better confirmation of the uptrend.
5. Targets: The potential targets are already marked on the chart as T1, T2, and T3 .
As this is my first published idea, I kindly ask you to ignore any mistakes, and I will strive to improve in the future.
Disclaimer:
This is purely an analysis and not investment advice. Please trade with due diligence and manage your risks carefully.
I hope you like my work, Thanks in advance.
Best regards - Anantesh
Wedge

The Falling Wedge Pattern: A Guide to Catching Bullish BreakoutsFalling Wedge Pattern: A Continuation Chart Pattern
Hello Traders!
In today's post, we’ll explore the Falling Wedge Pattern , one of the most reliable continuation patterns that traders look for during uptrends. It’s an important tool for identifying potential breakout points in trending markets. If you want to learn how to trade these breakouts effectively, mastering the Falling Wedge is essential.
The Falling Wedge pattern typically forms during an uptrend and consists of converging trendlines, where the price makes lower highs and lower lows. However, despite the price being pushed lower, the momentum starts weakening, and eventually, the price breaks above the upper trendline, signaling a continuation of the prevailing uptrend .
What is the Falling Wedge Pattern?
The Falling Wedge Pattern is characterized by two converging trendlines, where the upper trendline slopes downward more steeply than the lower trendline. This pattern shows a decreasing range between highs and lows, and when the price breaks above the upper trendline, it indicates a continuation of the uptrend .
Key Characteristics of the Falling Wedge Pattern
Uptrend Prior to the Pattern: The Falling Wedge pattern forms during a strong uptrend , signaling that the market is taking a brief pause before resuming the previous momentum.
Converging Trendlines: The pattern consists of two downward-sloping trendlines that converge, with the upper trendline steeper than the lower one. This shows that the selling pressure is weakening.
Breakout Confirmation: A bullish breakout occurs when the price breaks above the upper trendline, signaling the continuation of the uptrend .
Volume Increase on Breakout: The breakout is confirmed when there is an increase in volume, indicating strong momentum behind the move.
How to Trade the Falling Wedge Pattern?
Entry Point: The ideal entry point is when the price breaks above the upper trendline, confirming the bullish breakout .
Stop Loss: Place your stop loss just below the lower trendline or the most recent swing low to protect your trade from sudden market reversals.
Profit Target: Measure the height of the wedge and project that distance upward from the breakout point to determine the price target .
Risk Management Considerations
Position Sizing: Adjust your position size based on your risk tolerance and the distance between the entry point and the stop loss.
Stop Loss Placement: Make sure to place your stop loss in a way that minimizes risk but still gives enough room for the trade to move in your favor.
Wait for Confirmation: Always wait for the breakout confirmation, and make sure that the price action is supported by an increase in volume.
What This Means for Traders
The Falling Wedge pattern is an excellent tool for traders who are looking for reliable continuation trades in strong uptrends. It can help identify breakout points and offer favorable risk-to-reward setups when combined with other technical indicators.
Look for the Falling Wedge pattern during uptrends to identify high-probability continuation trades.
Confirm with volume to ensure the breakout is backed by strong momentum.
Use stop loss placement to manage risk effectively while targeting favorable risk-to-reward ratios.
Conclusion
The Falling Wedge pattern is a reliable continuation pattern that can help traders identify breakout opportunities in trending markets. By mastering its formation, waiting for the breakout confirmation, and managing risk effectively, you can increase the chances of a successful trade in the uptrend .
Have you traded the Falling Wedge pattern before?
Share your experiences and thoughts in the comments below! Let’s continue learning and growing as traders!

Nifty!Nifty Simple Explanation
Falling Wedge Formation: The chart shows a falling wedge pattern, which often signals a potential bullish reversal if the price breaks above the upper trendline.
Order Block (₹24,500–₹25,000): This zone represents strong supply or resistance. If the stock rallies, it may face selling pressure here, but reaching this area could mean a gain of about 28–30% from current levels.
Breakout vs Breakdown:
Breakout above the wedge indicates renewed buying interest and could drive the price into the order block.
Breakdown below the wedge suggests the downtrend remains in control.
Overall, watch for a wedge breakout for a bullish move, but be cautious of strong resistance in the ₹24,500–₹25,000 range.

Nifty in.tradingview.com
Nifty on a Descending triangle from the last few months, more healthy correction is highly anticipated.

NIFTY: At a Crucial Junction After a 13% Correction Topic Statement:
NIFTY has corrected 13% from its highs of 26,277 and is now trading within a converging pattern, where a breakout will determine the market’s next major move.
Key points:
1. The price is taking support on the long-term up trendline.
2. The price faces resistance as it approaches the short-term down trendline.
3. The two trendlines form a wedge, and a breakout from this pattern will decide the market’s direction.

SHAHALLOYS: Signs of Reversal?Hello fellow traders,
I hope everyone is doing well.
Please find my analysis for SHAHALLOYS below:
Key Observations:
1. Reversal from Support Zone: SHAHALLOYS appears to be reversing from a key support area.
2. 200 Weekly EMA Support: The price seems to be holding around the 200 Weekly EMA, indicating potential strength.
3. Chart Pattern: A falling wedge pattern is visible, which is typically a bullish reversal signal. The breakout and subsequent retest have already occurred.
4. Entry Point: A good entry opportunity could be around current levels of ₹69.19 level.
5. Targets: The potential targets are marked on the chart as T1, T2, and T3.
6. Risk-to-Reward Ratio: The trade offers an attractive R:R of 1:3.
Disclaimer:
This is purely an analysis and not investment advice. Please trade responsibly, conduct your own research, and manage your risks carefully.
I hope you find this analysis helpful. Thank you in advance for your support! 😊
Best regards,
Anantesh

NIFTY 50 I Falling Wedge Pattern + Bulllish Divergence Nifty 50 Index is currently trading within a very important zone in simple words called area of interest Usually consisting of demand or supply zone. This level has acted as a solid base for the index.
The NIFTY 50 index presents a promising opportunity to initiate long positions at these levels (CMP23,000), Aligning well with the risk reward ratio and making it a favourable entry point for traders looking for Taking advantage of the upcoming trend.
The index has shown a pattern of forming lower highs and lower lows, which indicates a downtrend. However, the Relative Strength Index (RSI) is showing a contrasting pattern of higher highs and higher lows. This divergence between price action and RSI suggests a potential shift in momentum and a possibility of a short covering rally.
Adding to this I see a falling wedge pattern which is a bullish signal suggesting an upward price movement which typically appears in a downtrend and often seen as a bullish Reversal pattern.
The analysis holds true when price close above 23,824 - daily timeframe.
While entering on current levels also has good opportunity of risk reward ratio, I suggest looking for a pin bar candle on today's close will Confirm Market picking support from the levels .
Conversely if nifty 50 index continues to recover, We could see a push towards 24,200 and 24,800 Which represent key Resistance areas. A good breakout above these levels likely signal Continuation of bullish trends in the indian markets.

USDJPY bearish signsUSDJPY might start the solid downtrend. Gradually falling down with falling wedge pattern breakdown. But dont get fooled and short immediately. It will give one healthy bounce too for the 0.23 fib levels as RSI also suggesting bit of oversold zone here, if it has to fall it will give one technical bounce. We have to observe it there closely if it rejects there or sustains above it. But as per my analysis slowly now trend is becoming bearish as per the weekly & daily chart analysis. As there is double top rejection is visible too in the chart.

OMUSDT(mantra) strong upmove on chartsOMUSDT from the current levels very bullish. Targets wont come in one day but it will come. Follow the post. will keep posting the small small but good target trades based on daily price action. This is long long term view. Same kind of prediction i have done for XRP too and look at it 10 times move from there. Mantra OM is fundamentally strong coin too so dont ignore this view. Expecting atleast 200% return from here in this coin.

ENAUSDT big target visible.ENA has very big target visible on the chart. very good accumulation zone. Keep adding in the trades. It can even blast upto 5 too.

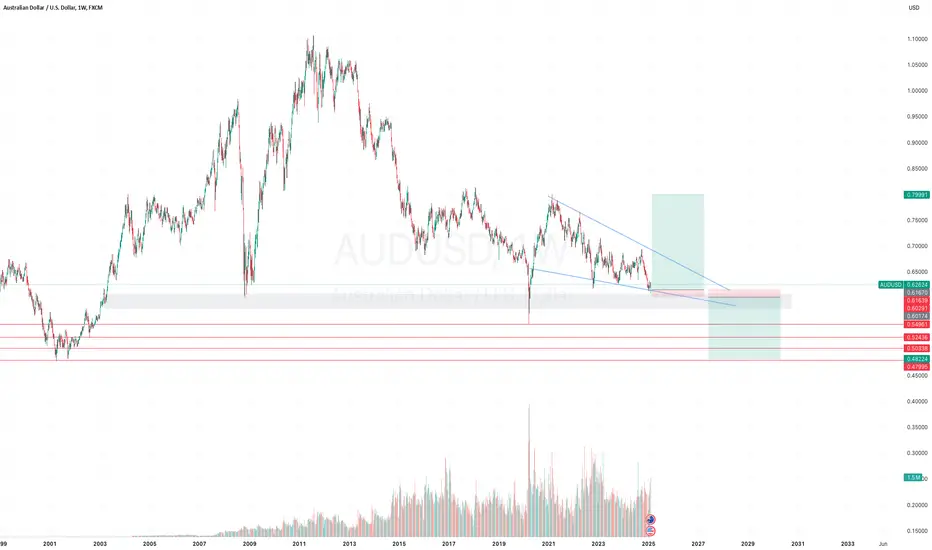
AUDUSD can move both side.AUDUSD current level should act as a support zone 0.62-0.58. If it breaks there will be massive downfall as per the pattern overview. 0.52 and 0.47 will be next stop. On contradiction there is also bullish wedge pattern forming which could also kill the sellers. One can easily try the big long with 2% SL & target above 10% 20%. If SL hit just reverse the position for bottom level liquidity targets. 0.54 0.52 0.47
EURUSD looking super bearish long termEURUSD somehow not able to sustain at the higher levels falling from the bearish wedge pattern. Creating multiple tops and not looking confident at higher level. RSI is also suggesting more selloff pending from the current levels. Uptrend will only positive if it sustains above 1.06300. Otherwise i can see it is ready to hunt the liquidity levels of 0.974 0.964 0.953


The Mirage of Eternal Growth: Nifty, Sensex in 2024INDEX:SENSEX
In the realm of stock markets, where optimism can often overshadow caution, the upward trajectory of indices like the Nifty and Sensex can be both alluring and deceptive. For the past eight years, these indices have exhibited an unbroken streak of growth, painting a picture of perpetual prosperity. However, beneath the surface lies a pattern that portends caution rather than celebration – the rising wedge pattern.
The Nifty and Sensex, the barometers of India's economic health, have become synonymous with stability and growth. For nearly a decade, investors have enjoyed a bull market, with each passing year seemingly better than the last. The absence of any annual red bars, indicative of negative growth, has only reinforced the prevailing sentiment of optimism.
But amidst the euphoria, a discerning eye may notice the emergence of a concerning trend – the rising wedge pattern. This technical analysis formation, characterised by converging trendlines with higher highs and higher lows, often signals a potential reversal in market direction. While it's easy to dismiss such patterns in the midst of a prolonged bull run, history teaches us to heed the warnings they offer.
Indeed, the implications of this rising wedge pattern extend beyond the confines of Indian markets. As global economic interdependencies continue to deepen, any significant event on the world stage can send ripples across international markets. Whether it's the outcome of a pivotal election or the outbreak of a geopolitical crisis like World War 3, the reverberations can be felt far and wide.
The looming spectre of the May 2024 election result presents a critical juncture for Indian markets. Political uncertainty has always been a source of volatility, and the outcome of this election could either reaffirm investor confidence or trigger a reassessment of market fundamentals. Similarly, the threat of a global conflict looms ominously, casting a shadow over the stability of financial markets worldwide.
In light of these potential catalysts for volatility, it's imperative for investors to exercise caution and prudence. While the allure of continued growth may be enticing, it's essential to recognise the inherent risks that accompany such prolonged periods of bullish sentiment. Blind optimism can quickly turn into panic when confronted with unexpected events, leading to precipitous declines in stock prices.
Moreover, the interconnected nature of global markets means that no economy exists in isolation. What happens halfway across the world can have profound implications for domestic markets, amplifying the need for a diversified and resilient investment strategy. Rather than succumbing to the allure of short-term gains, investors would be wise to adopt a long-term perspective that prioritises stability and risk management.
In conclusion, while the Nifty and Sensex may have enjoyed a remarkable run of growth in recent years, the emergence of the rising wedge pattern warrants caution. The prospect of major events such as the May 2024 election result or the outbreak of global conflict introduces a level of uncertainty that cannot be ignored. As investors navigate these choppy waters, it's essential to remain vigilant and adaptable, recognising that the road to prosperity may be fraught with obstacles.

Nifty 50 Ready for 24200?📊 Nifty 50 Daily Analysis
🔸 Current Resistance:
Nifty is facing resistance at the 50 DMA and the top of the wedge pattern.
🔸 Market Structure:
The structure remains Lower Highs (LH) and Lower Lows (LL), keeping the bearish trend intact.
🔸 Key Support Levels:
Pivot 1: 23,534 (must hold for bullish momentum).
Recent Swing Low: 22,783 (breaking this could push Nifty down to 21,800).
🔸 Upside Potential:
If Nifty consolidates tightly above Pivot 1 with small candles, a breakout could happen with target 24,200. However, expect challenges with multiple resistances ahead.
⚠️ Challenges to the Uptrend:
Average corporate earnings may limit optimism.
Global factors like yields and economic data could act as headwinds.
Nifty is below 50 and 200 DMAs, signaling weak sentiment.
📅 Key Upcoming Events:
RBI Policy Meeting: Interest rate decisions 🏦
US Non-Farm Payroll Data: Impacting global flows 📈
Quarterly Earnings: Heavyweights’ performance 🏢
Budget Announcements: Fiscal policy insights 🗂️
Global Factors: Fed updates and crude oil trends 🌎
MSCI Index Rebalancing
Summary:
✔️ Bullish View: A breakout above Pivot 1 may lead to 24,200.
❌ Bearish View: Breaking 22,783 increases the chances of a drop to 21,800.
👉 Nifty's upward journey won’t be smooth, so trade cautiously.

Nifty 50 | Falling Wedge Pattern – A Bullish Breakout Ahead?Hello everyone! I hope you all are doing great in life and in your trading journey. Today, I have brought an in-depth analysis of Nifty 50 , focusing on a powerful Falling Wedge Pattern that is currently forming on the charts. This pattern is known for signaling a bullish reversal , provided we get a confirmed breakout . If this pattern plays out as expected, we could witness a strong upward move in the coming sessions.
Currently, Nifty is trading near a strong support zone around 22,777 – 22,900 , where buyers have previously shown interest. The price is moving within a converging downward-sloping range , indicating that selling pressure is weakening . Key resistance levels to watch post-breakout include 23,700, 24,207, 24,781, 25,191, and 26,277 , with a stop-loss placed below 22,777 to manage risk effectively . However, this analysis holds true only if Nifty breaks out of the Falling Wedge Pattern; until then, caution is advised.
If the breakout is confirmed with good volume, we might see a strong rally ahead, potentially targeting the marked resistance levels. As always, patience and discipline are key—wait for confirmation before making any trading decisions.
Disclaimer:- This analysis is for educational purposes only. Please trade responsibly and consult a financial advisor before making any decisions.
If you found this analysis helpful, don’t forget to like, follow, and share your thoughts in the comments below! Your support keeps me motivated to share more insights. Let’s grow and learn together—happy trading!

AmbujacemAmbujacement wedge pattern formed. We can buy if the upside resistance breakout. We can sell if the downside support breakout,wait for 5 minite candles body to be breakout.

Persistent Systems: Bull Run with Breakout Potential Topic Statement: Persistent Systems is on a strong bull run, showing resilience to the market correction, with a wedge pattern signaling a potential breakout.
Key Points:
1. The stock receives heavy support near the 180-day moving average, making it a good entry point.
2. Candlesticks are forming a wedge pattern, indicating a big directional move upon breakout.
3. The price faces heavy resistance at the ₹6500 level.
4. Company reported a 30% profit growth QoQ.

Trump's Time ! Trump coin set to launch bull rocket.Trump meme coin is ready to take a big move toward upside and we can see a good pump very soon.

Nifty Hourly Hello,
Nifty Hourly Squeeze RSI oversold and positive divergences near support (demand) zone possibility of reversal and once break 23500 good long for 23800,24000,24300++ oscillators are bullish.

National Aluminum Co Ltd - Looks Good.Candidate looks good for swing trade with target of 240 INR. and S/L of 180 INR. CMP 205.54 INR.
Reason
Swing Trade
Touch Point reversal
MACD Cross Over
Continuation Wedge (Bullish) Pattern formation
PLEASE NOTE THAT:
This chart analysis is only for reference purpose.
This is not buying or selling recommendations.
I am not SEBI registered.
Please consult your financial advisor before taking any trade.

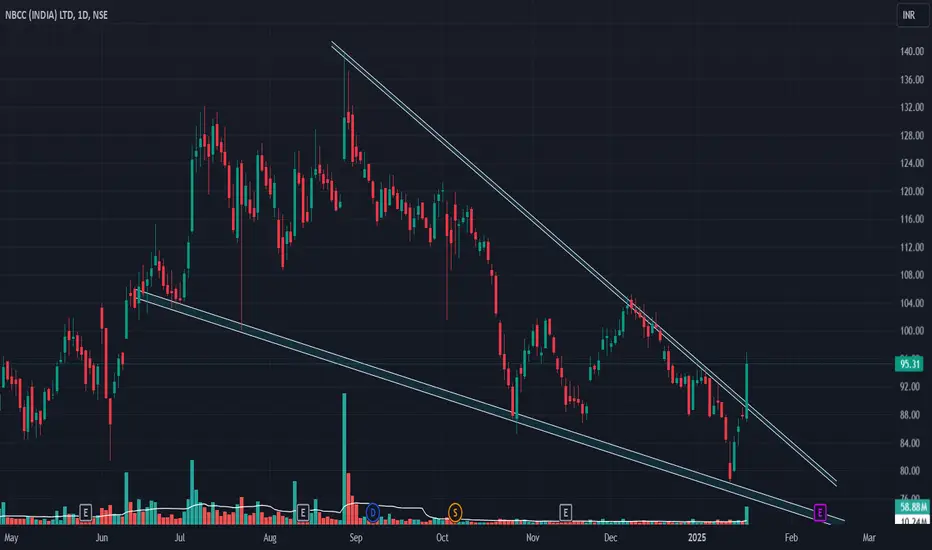
NBCC INDIADisclaimer : Trade at your own risk this is not buy - sell recommendation, I'm not sebi registered.
NBCC looks very bullish on daily, weekly and monthly charts keep on radar.
Bank Nifty - Is this A Rising Wedge from 47898 As discussed early morning .... 49000 was our key & psychological level ... Index dropped & came close to 48500-48600 zone
Falling From 49000 Level
Support Zone 48500-48600
Makar Sankranti marks the Sun's transition into Capricorn and the beginning of an auspicious period. Historically, equity markets turn optimistic post-Makar Sankranti, driven by cultural sentiment and Budget expectations. Will Budget 2025 keep the trend alive? 🌞
This comes after a 26-day fall in major benchmark indices, which started on 5th Dec 2024.
In the last two days, the index surged from 47,898 to 49,000. However, during the first half of today's session (15th Jan 2025), it fell below 49,000, hitting a low of 48,522 as shown in the snapshots
