💹 A.U. Small Finance Bank Ltd (NSE: AUBANK)
Sector: Banking & Finance | CMP: ₹865.20 | View: Bullish Momentum Setup
🔹Price Action:
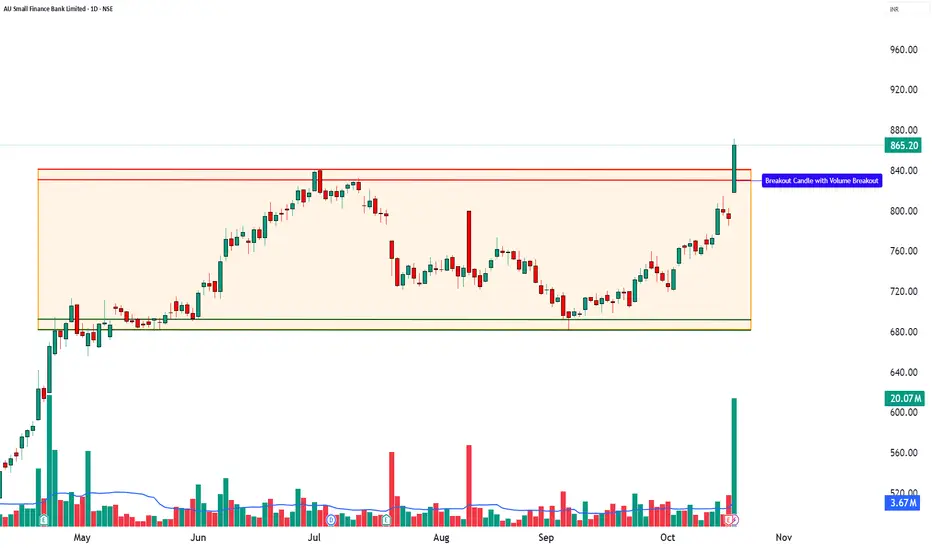
A.U. Small Finance Bank showed strong upward movement with a big green candle and very high trading volume. The stock opened at its lowest point and kept rising all day, which means buyers were in full control. It also made a new 52-week high, showing that momentum and confidence are strong. In simple words, the stock is breaking out with power, and buyers are clearly leading the trend.
🔹 Technical Analysis:
AUBANK is showing strong bullish momentum with a clear 52-week breakout, signaling fresh buying interest and strong confidence among traders. The big green candle with open-equals-low formation shows that buyers were active right from the start of the session. The RSI at 81 reflects strong momentum, while MACD at 9.35 confirms a positive crossover, adding to the bullish view. Similarly, CCI at 258 and Stochastic at 96 indicate powerful buying pressure, suggesting that the uptrend is well-supported. The VWAP at ₹855.39 is acting as an important support level, helping the price stay stable even during intraday pullbacks. Meanwhile, a Bollinger Band breakout and a BB squeeze-off pattern hint that the stock may continue its sharp upward move. Altogether, the indicators show a well-supported bullish setup, ideal for short to medium-term swing trades.
🔹 Volume Analysis:
The stock saw a huge rise in trading volume — almost 5 times higher than normal! This is a strong sign that big investors or institutions are showing interest. Such a jump in both price and volume means the breakout is real and reliable, not just a short-term move. This kind of volume confirms fresh buying and positive sentiment, suggesting the stock could stay strong for some time.
🔹 Chart Analysis:
For months, AUBANK was moving sideways between ₹680 and ₹840. Now, it has broken above ₹840 with heavy volume, showing that the stock has ended its consolidation phase and started a new bullish trend. This breakout shows that buyers are taking charge, and if the volume remains high, the stock may continue to move upward in the coming sessions.
🔹 Demand Zone: ₹814 – ₹785
This area acts as a strong demand zone, where earlier buying interest was visible. If the price revisits this zone, it may attract fresh accumulation or renewed buying activity. Traders and learners can observe this region for potential re-entry setups once the price shows signs of stability or reversal — purely for educational understanding of demand zone behavior in momentum setups.
🔹 Key Levels:
Resistance: 885/905/939
Support: 832/798/778
🔹 STWP Trade Analysis:
Bias: Bullish
Breakout Level: 872
Intraday Support: 851
Swing Support: 783
Intermediate Support: 680
Observation:
🔹 Final Outlook:
Momentum: Moderate | Trend: Neutral | Risk: High | Volume: High
The setup shows strong bullish signs but comes after a sharp rally, so short-term volatility can be expected. Sustained volume above ₹850 will keep the trend positive.
🔹 Learning Note (Educational Purpose):
This setup is a good example of how volume + breakout candles signal a shift in momentum. It teaches traders that when price breaks resistance with strong volume, it often marks the beginning of a new trend rather than the end of one. Always confirm with RSI/MACD alignment for reliability.
🔹 STWP Mentor Note:
Momentum trading works best when price, structure, and volume align together. Always look for clean breakouts backed by heavy volume — they tell you where smart money is moving. As a trader, focus more on learning price behavior than just chasing the move. Every breakout teaches patience, confidence, and timing — three pillars of successful trading.
───────────────────────────────────────────────
⚠️ **DISCLOSURE & DISCLAIMER (SEBI-Compliant)**
───────────────────────────────────────────────
📘 **Purpose:**
This content is created **solely for educational and informational purposes** to help readers understand market structure, price action, and technical analysis.
It does **not constitute investment advice**, research recommendation, or a solicitation to buy or sell any security.
👤 **Author Disclosure:**
The author is **not a SEBI-registered investment adviser or research analyst.**
All chart studies, price levels, and observations are based on publicly available data (e.g., **NSE India**, **TradingView**) and are presented purely for **learning illustration**.
📊 **Position Status:**
No active position in *[AUBANK]* at the time of publication.
“The author may sometimes trade in the securities discussed, but such trades are independent and shared here only for educational understanding.”
⚠️ **Risk Disclosure:**
Trading and investing involve financial risk. Market movements can be unpredictable, and losses may exceed invested capital.
Readers are strongly advised to consult a **SEBI-registered investment adviser** before making any trading or investment decisions.
🧠 **Responsibility Clause:**
By engaging with this post, you acknowledge that you are **solely responsible for your own trading or investment decisions**, and that this content is intended only for **market education and awareness**.
───────────────────────────────────────────────
💬 **Did You Find This Useful?**
If this analysis helped you understand price structure or market psychology better:
🔼 **Boost** to support transparent & structured financial education.
✍️ **Comment** your insights, observations, or questions — let’s learn together.
🔁 **Share** this post with learners and aspiring traders who value discipline.
📚 **Follow STWP** for more structured, educational breakdowns on stocks & setups.
🚀 *Stay Calm. Stay Clean. Trade With Patience.*
💡 *Trade Smart | Learn Zones | Be Self-Reliant.*
───────────────────────────────────────────────
Sector: Banking & Finance | CMP: ₹865.20 | View: Bullish Momentum Setup
🔹Price Action:
A.U. Small Finance Bank showed strong upward movement with a big green candle and very high trading volume. The stock opened at its lowest point and kept rising all day, which means buyers were in full control. It also made a new 52-week high, showing that momentum and confidence are strong. In simple words, the stock is breaking out with power, and buyers are clearly leading the trend.
🔹 Technical Analysis:
AUBANK is showing strong bullish momentum with a clear 52-week breakout, signaling fresh buying interest and strong confidence among traders. The big green candle with open-equals-low formation shows that buyers were active right from the start of the session. The RSI at 81 reflects strong momentum, while MACD at 9.35 confirms a positive crossover, adding to the bullish view. Similarly, CCI at 258 and Stochastic at 96 indicate powerful buying pressure, suggesting that the uptrend is well-supported. The VWAP at ₹855.39 is acting as an important support level, helping the price stay stable even during intraday pullbacks. Meanwhile, a Bollinger Band breakout and a BB squeeze-off pattern hint that the stock may continue its sharp upward move. Altogether, the indicators show a well-supported bullish setup, ideal for short to medium-term swing trades.
🔹 Volume Analysis:
The stock saw a huge rise in trading volume — almost 5 times higher than normal! This is a strong sign that big investors or institutions are showing interest. Such a jump in both price and volume means the breakout is real and reliable, not just a short-term move. This kind of volume confirms fresh buying and positive sentiment, suggesting the stock could stay strong for some time.
🔹 Chart Analysis:
For months, AUBANK was moving sideways between ₹680 and ₹840. Now, it has broken above ₹840 with heavy volume, showing that the stock has ended its consolidation phase and started a new bullish trend. This breakout shows that buyers are taking charge, and if the volume remains high, the stock may continue to move upward in the coming sessions.
🔹 Demand Zone: ₹814 – ₹785
This area acts as a strong demand zone, where earlier buying interest was visible. If the price revisits this zone, it may attract fresh accumulation or renewed buying activity. Traders and learners can observe this region for potential re-entry setups once the price shows signs of stability or reversal — purely for educational understanding of demand zone behavior in momentum setups.
🔹 Key Levels:
Resistance: 885/905/939
Support: 832/798/778
🔹 STWP Trade Analysis:
Bias: Bullish
Breakout Level: 872
Intraday Support: 851
Swing Support: 783
Intermediate Support: 680
Observation:
🔹 Final Outlook:
Momentum: Moderate | Trend: Neutral | Risk: High | Volume: High
The setup shows strong bullish signs but comes after a sharp rally, so short-term volatility can be expected. Sustained volume above ₹850 will keep the trend positive.
🔹 Learning Note (Educational Purpose):
This setup is a good example of how volume + breakout candles signal a shift in momentum. It teaches traders that when price breaks resistance with strong volume, it often marks the beginning of a new trend rather than the end of one. Always confirm with RSI/MACD alignment for reliability.
🔹 STWP Mentor Note:
Momentum trading works best when price, structure, and volume align together. Always look for clean breakouts backed by heavy volume — they tell you where smart money is moving. As a trader, focus more on learning price behavior than just chasing the move. Every breakout teaches patience, confidence, and timing — three pillars of successful trading.
───────────────────────────────────────────────
⚠️ **DISCLOSURE & DISCLAIMER (SEBI-Compliant)**
───────────────────────────────────────────────
📘 **Purpose:**
This content is created **solely for educational and informational purposes** to help readers understand market structure, price action, and technical analysis.
It does **not constitute investment advice**, research recommendation, or a solicitation to buy or sell any security.
👤 **Author Disclosure:**
The author is **not a SEBI-registered investment adviser or research analyst.**
All chart studies, price levels, and observations are based on publicly available data (e.g., **NSE India**, **TradingView**) and are presented purely for **learning illustration**.
📊 **Position Status:**
No active position in *[AUBANK]* at the time of publication.
“The author may sometimes trade in the securities discussed, but such trades are independent and shared here only for educational understanding.”
⚠️ **Risk Disclosure:**
Trading and investing involve financial risk. Market movements can be unpredictable, and losses may exceed invested capital.
Readers are strongly advised to consult a **SEBI-registered investment adviser** before making any trading or investment decisions.
🧠 **Responsibility Clause:**
By engaging with this post, you acknowledge that you are **solely responsible for your own trading or investment decisions**, and that this content is intended only for **market education and awareness**.
───────────────────────────────────────────────
💬 **Did You Find This Useful?**
If this analysis helped you understand price structure or market psychology better:
🔼 **Boost** to support transparent & structured financial education.
✍️ **Comment** your insights, observations, or questions — let’s learn together.
🔁 **Share** this post with learners and aspiring traders who value discipline.
📚 **Follow STWP** for more structured, educational breakdowns on stocks & setups.
🚀 *Stay Calm. Stay Clean. Trade With Patience.*
💡 *Trade Smart | Learn Zones | Be Self-Reliant.*
───────────────────────────────────────────────
STWP | Mentor & Demand-Supply Specialist | Empowering traders through structured learning |
simpletradewithpatience.com
Community: chat.whatsapp.com/BEYz0tkqP0fJPBCWf59uel
wa.me/message/6IOPHGOXMGZ4N1
Educational Only
simpletradewithpatience.com
Community: chat.whatsapp.com/BEYz0tkqP0fJPBCWf59uel
wa.me/message/6IOPHGOXMGZ4N1
Educational Only
Related publications
Disclaimer
The information and publications are not meant to be, and do not constitute, financial, investment, trading, or other types of advice or recommendations supplied or endorsed by TradingView. Read more in the Terms of Use.