📌 Overview
The AVA/USDT weekly chart shows a dramatic journey:
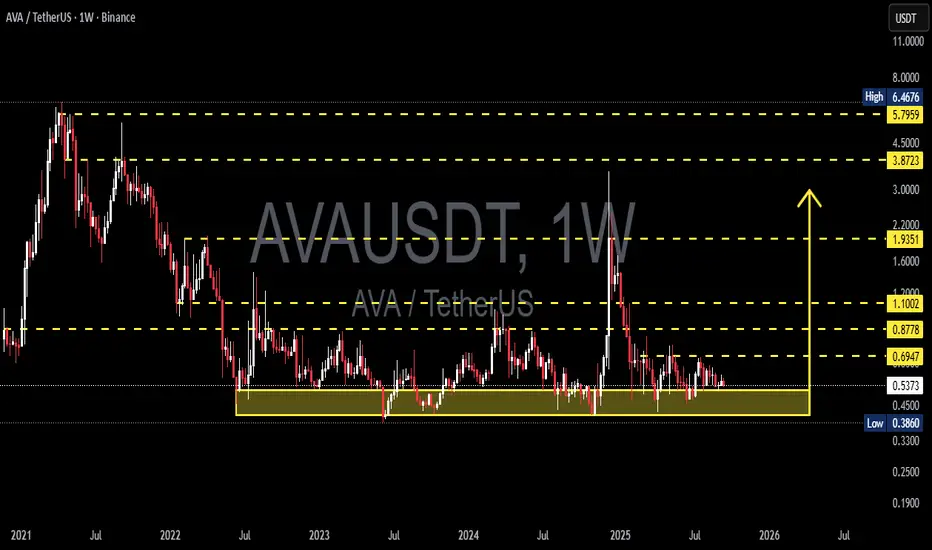
From the 2021 peak ($6–7), price has been in a prolonged downtrend followed by sideways consolidation since 2022.
For nearly 3 years, the yellow zone ($0.38 – $0.45) has acted as a battlefield between buyers and sellers.
Each test of this area has resulted in strong rebounds, marking it as a major demand zone.
Now, AVA is once again hovering near this critical support. The big question: Is this the ultimate long-term accumulation zone or the start of a deeper breakdown?
---
🔍 Pattern & Structure Analysis
Macro trend: Bearish since 2021 → long consolidation from 2022–2025.
Dominant pattern: Wide sideways range with a solid base at 0.38–0.45 and tiered resistances at 0.69, 0.87, 1.10, 1.93.
Price character:
Multiple lower wicks into demand zone → sign of liquidity grabs and potential accumulation by bigger players.
Prolonged sideways near lows suggests a possible bottoming formation.
However, compression against support can also lead to a breakdown if bulls lose control.
---
🟢 Bullish Scenario
If buyers defend 0.38–0.45 and push higher:
1. First confirmation: Weekly close above 0.6947.
2. Upside targets:
0.8778 → first mid-term resistance.
1.1002 → psychological & structural breakout zone.
1.9351 → major resistance, early trend reversal confirmation.
3. With strong momentum, a revisit of 3.87 – 5.79 (the 2021 supply zone) remains possible in the next bull cycle.
(Potential gains: +63% to 0.87 / +105% to 1.10 from current price ~0.53).
---
🔴 Bearish Scenario
If a strong weekly close below 0.386 occurs:
1. The 3-year demand zone will fail → showing buyers have lost control.
2. Downside target: 0.25 – 0.19 as the next realistic demand area.
3. Extreme measured-move projection even points to 0.07 (though unlikely, it must be considered).
(Downside risk: −53% to 0.25 from current price).
---
📊 Key Takeaways
$0.38–0.45 = pivotal demand zone for AVA’s next cycle.
Breakout above 0.69 = early bullish signal.
Breakdown below 0.38 = opens risk of new all-time lows.
This zone will decide whether AVA enters a new accumulation phase or faces final capitulation.
---
Critical demand zone = 0.38–0.45.
Watch 0.6947 breakout for bullish bias.
Watch 0.386 breakdown for bearish continuation.
Momentum will reveal if this is smart money accumulation or a last leg down.
---
#AVA #AVAUSDT #CryptoAnalysis #WeeklyChart #Altcoins #TechnicalAnalysis #SupportResistance #CryptoTrading #ChartPatterns
The AVA/USDT weekly chart shows a dramatic journey:
From the 2021 peak ($6–7), price has been in a prolonged downtrend followed by sideways consolidation since 2022.
For nearly 3 years, the yellow zone ($0.38 – $0.45) has acted as a battlefield between buyers and sellers.
Each test of this area has resulted in strong rebounds, marking it as a major demand zone.
Now, AVA is once again hovering near this critical support. The big question: Is this the ultimate long-term accumulation zone or the start of a deeper breakdown?
---
🔍 Pattern & Structure Analysis
Macro trend: Bearish since 2021 → long consolidation from 2022–2025.
Dominant pattern: Wide sideways range with a solid base at 0.38–0.45 and tiered resistances at 0.69, 0.87, 1.10, 1.93.
Price character:
Multiple lower wicks into demand zone → sign of liquidity grabs and potential accumulation by bigger players.
Prolonged sideways near lows suggests a possible bottoming formation.
However, compression against support can also lead to a breakdown if bulls lose control.
---
🟢 Bullish Scenario
If buyers defend 0.38–0.45 and push higher:
1. First confirmation: Weekly close above 0.6947.
2. Upside targets:
0.8778 → first mid-term resistance.
1.1002 → psychological & structural breakout zone.
1.9351 → major resistance, early trend reversal confirmation.
3. With strong momentum, a revisit of 3.87 – 5.79 (the 2021 supply zone) remains possible in the next bull cycle.
(Potential gains: +63% to 0.87 / +105% to 1.10 from current price ~0.53).
---
🔴 Bearish Scenario
If a strong weekly close below 0.386 occurs:
1. The 3-year demand zone will fail → showing buyers have lost control.
2. Downside target: 0.25 – 0.19 as the next realistic demand area.
3. Extreme measured-move projection even points to 0.07 (though unlikely, it must be considered).
(Downside risk: −53% to 0.25 from current price).
---
📊 Key Takeaways
$0.38–0.45 = pivotal demand zone for AVA’s next cycle.
Breakout above 0.69 = early bullish signal.
Breakdown below 0.38 = opens risk of new all-time lows.
This zone will decide whether AVA enters a new accumulation phase or faces final capitulation.
---
Critical demand zone = 0.38–0.45.
Watch 0.6947 breakout for bullish bias.
Watch 0.386 breakdown for bearish continuation.
Momentum will reveal if this is smart money accumulation or a last leg down.
---
#AVA #AVAUSDT #CryptoAnalysis #WeeklyChart #Altcoins #TechnicalAnalysis #SupportResistance #CryptoTrading #ChartPatterns
✅ Get Free Signals! Join Our Telegram Channel Here: t.me/TheCryptoNuclear
✅ Twitter: twitter.com/crypto_nuclear
✅ Join Bybit : partner.bybit.com/b/nuclearvip
✅ Benefits : Lifetime Trading Fee Discount -50%
✅ Twitter: twitter.com/crypto_nuclear
✅ Join Bybit : partner.bybit.com/b/nuclearvip
✅ Benefits : Lifetime Trading Fee Discount -50%
Disclaimer
The information and publications are not meant to be, and do not constitute, financial, investment, trading, or other types of advice or recommendations supplied or endorsed by TradingView. Read more in the Terms of Use.