Overview:
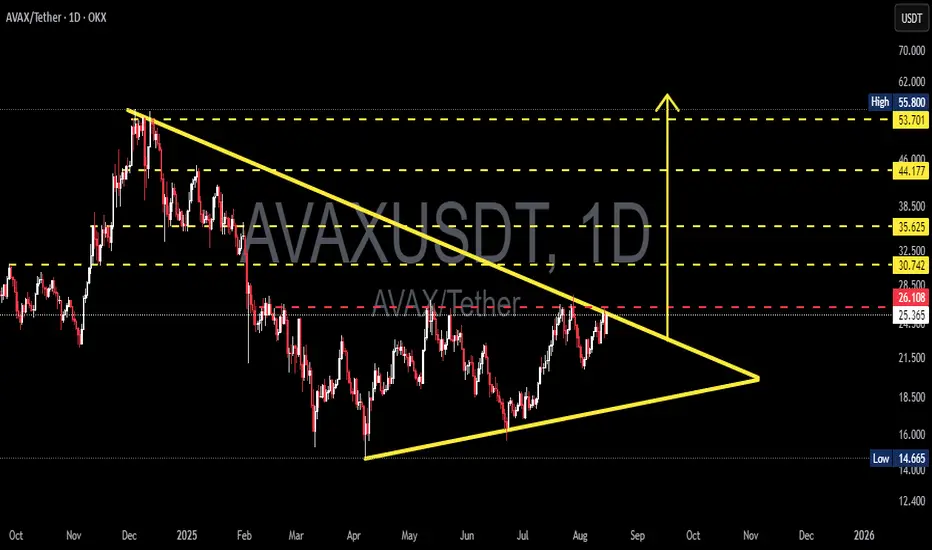
The daily chart shows AVAX forming a symmetrical triangle (converging trendlines) since the Dec–Jan peak. Price is now testing the upper resistance trendline (~26.1 USDT) — we’re at a critical point heading toward the apex (late September). Volume behavior and a confirmed daily candle close will be key to determining the breakout direction.
---
1) Pattern Description
Pattern: Symmetrical Triangle — characterized by lower highs (descending resistance line from the peak) and higher lows (ascending support line from the April bottom). Price range is narrowing → volatility dropping → usually leads to a strong move when the pattern resolves.
Context: The broader trend before the triangle was bearish (drop from ~55.8). Symmetrical triangles can be neutral but often resolve in the direction of the prior trend — technical confirmation is essential.
---
2) Key Levels (from chart)
Upper resistance trendline / critical level: ~26.10 USDT (red dashed line), current price ≈ 25.3 USDT.
Major resistance targets: 30.74, 35.62, 44.18, 53.70 – 55.80.
Ascending support trendline: around 18–22 USDT depending on timing.
Structural low: 14.665 USDT (chart low).
(Values estimated visually from chart — verify with live data before trading.)
---
3) Bullish Scenario (if breakout upward)
Bullish Trigger
Daily close above descending trendline (~26.1) with strong volume → breakout confirmation.
Preferably supported by bullish technical indicators (RSI, MACD bullish crossover, rising OBV).
Targets
Step targets: 30.7 → 35.6 → 44.2 → 53.7 (partial profit-taking recommended).
Measured move theoretical target:
− Height ≈ 55.800 − 14.665 = 41.135.
− Added to breakout point (~26.108) → theoretical target ≈ 67.24 USDT (for reference, not guaranteed).
Risk Management
Stop-loss: daily close back below breakout trendline or under nearest swing low (e.g., conservative SL < 21–22 USDT).
Strategy: scale in — partial entry before breakout, add after confirmation. Monitor risk/reward closely.
---
4) Bearish Scenario (if rejected / breakdown)
Bearish Trigger
Rejection at upper trendline + bearish daily candle (and/or rising sell volume) → drop to ascending support.
Breakdown confirmation: daily close below ascending trendline with strong volume.
Targets
Initial drop to ascending support ~18–22 USDT.
If breakdown continues → possible retest of 14.66 USDT low.
Risk Management for Shorts / Cut-loss
SL for shorts: daily close above resistance (~>28 USDT) or above fake breakout highs.
Beware of bull traps — volume confirmation reduces risk.
---
5) Practical Trade Plans (example)
Conservative Long: Wait for daily close > 26.1 + strong volume → enter 50% position; add after retest. Targets: 30.7 / 35.6. SL under retest zone (~21–22).
Conservative Short: If clear rejection at upper trendline → short toward lower trendline. SL above recent high (~28).
Range Trading: Buy near lower trendline, sell near upper trendline until breakout confirmed.
---
6) Risk & Confluence Checks
Broader market/Bitcoin sentiment: AVAX is often correlated, which can amplify moves.
Supporting indicators: check volume, RSI, MACD, EMA(50/200) for confirmation.
Watch for false breakouts — confirm with volume + retests.
---
7) Summary
> AVAX is forming a Symmetrical Triangle. Critical resistance at ~26.1 USDT — daily close + volume will decide the next move. Valid breakout → step targets at 30.7 / 35.6 / 44.2 (measured move theoretical ~67.2). Rejection / breakdown → support at 18–22 and possible drop to 14.66. Manage risk with confirmation, stop-loss, and partial profit-taking.
#AVAX #AVAXUSDT #Crypto #TechnicalAnalysis #Triangle #Breakout #SupportResistance #Altcoin #SwingTrading
✅ Get Free Signals! Join Our Telegram Channel Here: t.me/TheCryptoNuclear
✅ Twitter: twitter.com/crypto_nuclear
✅ Join Bybit : partner.bybit.com/b/nuclearvip
✅ Benefits : Lifetime Trading Fee Discount -50%
✅ Twitter: twitter.com/crypto_nuclear
✅ Join Bybit : partner.bybit.com/b/nuclearvip
✅ Benefits : Lifetime Trading Fee Discount -50%
Disclaimer
The information and publications are not meant to be, and do not constitute, financial, investment, trading, or other types of advice or recommendations supplied or endorsed by TradingView. Read more in the Terms of Use.