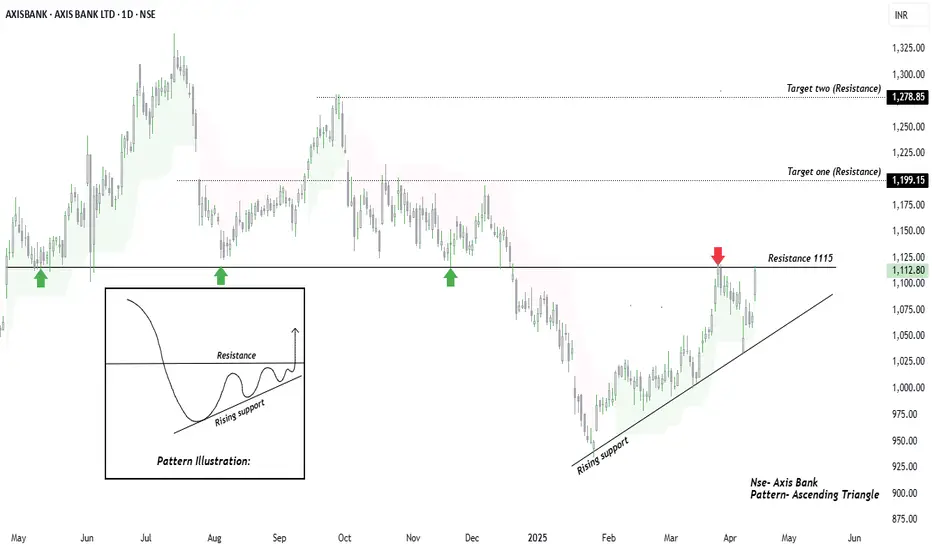
Hi friends! Sharing daily chart of Axis bank as we can see price is forming a classic Ascending triangle pattern on provided time farme a bullish setup that often signals accumulation before breakout and the price is pressing against a well established horizontal resistance which has historically acted as a strong support as marked by green arrows.
A decisive breakout above 1115 resistance backed by strong volume, could lead to a significant upward move toward marked targets. However if the price fails to break out we may see a retest of the rising trendline support.
This setup offers a clean structure for traders watching for a potential breakout or pullback entry. The pattern sketch in the chart serves as a visual reference for educational purposes.
Targets mentioned on provided chart and a good support can be consider a close below rising support line after breakout.
This idea is meant for only learning purpose.
Hope you like the publication, Thanks in advance.
Trade active
Going good going bullish !Yesterday added testing quantity on smaller timeframe, today waiting for a breakout retest but not happned as yesterday closed much higher from breakout point on provided time frame, but still happy that analysis going in wanted direction.
Note
Close to target oneNote
Almost touched made high of 1196.80 so far.Trade closed: target reached
After a good breakout, the target has been reached. Despite very bullish price action and sentiments, it could not break the target resistance in the first attempt, hence profit was booked by placing a pre-order. Let us see whether the price retests the first breakout or breaks the target resistance and moves towards the second target resistance.Related publications
Disclaimer
The information and publications are not meant to be, and do not constitute, financial, investment, trading, or other types of advice or recommendations supplied or endorsed by TradingView. Read more in the Terms of Use.
Related publications
Disclaimer
The information and publications are not meant to be, and do not constitute, financial, investment, trading, or other types of advice or recommendations supplied or endorsed by TradingView. Read more in the Terms of Use.