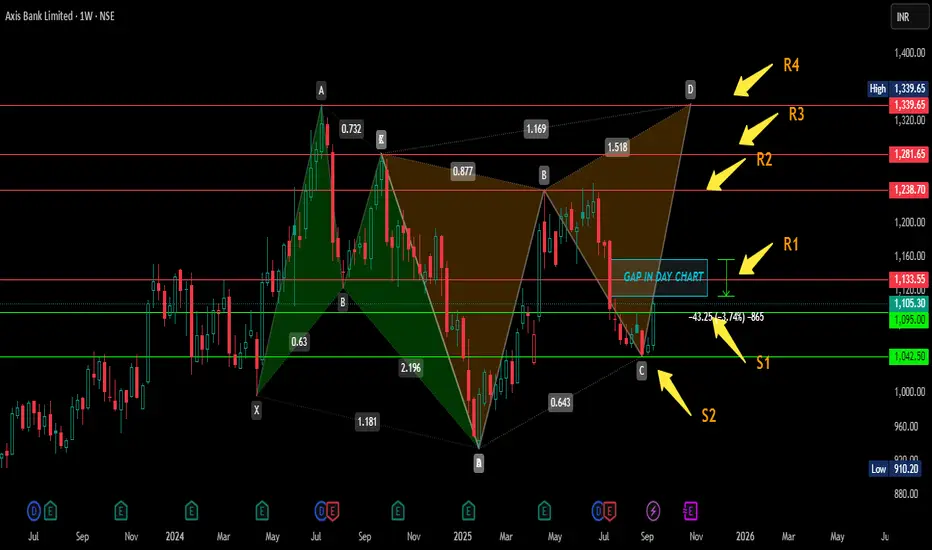
In this chart two butterfly patterns are plotted here one of them ia green which is comleted it's pattern as butterfly.
> Now other one is orrange in colour which is started to form BUTTERFY OR BAT i don't know, but my view is clear in this plot as i am expecting buttrfly.let's see what would be.
> Let me explain this chart is weekly where i mentioned support and resistance in green and red lines and marked by arrows.this support and resistances are on the basis of previous high or low so there should no one to be confused.
> Here weekly candle is closed above previous week high which is mentioned as S1.
> One more thing which i would like to say tou all that there is huge gap of almost 4% is mentioned as rectangle if you go in day chart it will be visible and i am expecting that this gap may be filled .
this is not my buy/sell call.
Disclaimer
The information and publications are not meant to be, and do not constitute, financial, investment, trading, or other types of advice or recommendations supplied or endorsed by TradingView. Read more in the Terms of Use.
Disclaimer
The information and publications are not meant to be, and do not constitute, financial, investment, trading, or other types of advice or recommendations supplied or endorsed by TradingView. Read more in the Terms of Use.