1. Introduction
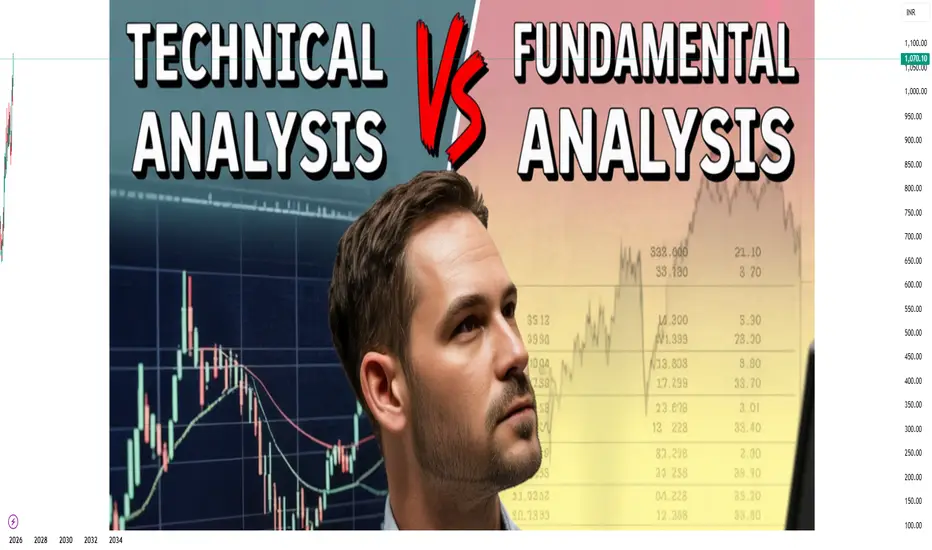
Financial markets are complex ecosystems influenced by economic, political, social, and psychological factors. To navigate these markets effectively, traders and investors employ strategies that analyze price movements, market trends, company performance, and economic indicators. Technical analysis and fundamental analysis represent the two main schools of thought in this regard.
Technical analysis focuses on price and volume data to forecast future market behavior.
Fundamental analysis evaluates the intrinsic value of an asset based on economic, financial, and qualitative factors.
Both methods have unique merits and limitations. Their effectiveness often depends on the investor's time horizon, risk tolerance, and market context.
2. Understanding Technical Analysis
2.1 Definition
Technical analysis is a method of evaluating securities by analyzing statistical trends derived from trading activity, such as price movements, trading volume, and historical data. The core belief of technical analysts is that all relevant information is already reflected in the market price. Therefore, price patterns and trends provide valuable insights into future market behavior.
2.2 Key Principles of Technical Analysis
Price Discounts Everything: All known information—financial, political, or psychological—is already priced into the security.
Prices Move in Trends: Market prices rarely move randomly; they follow identifiable trends over time.
History Tends to Repeat Itself: Market psychology is relatively predictable, and historical price patterns often recur.
2.3 Tools and Techniques
Technical analysis employs various tools, including:
Charts: Line charts, bar charts, candlestick charts.
Indicators: Moving averages, Relative Strength Index (RSI), MACD (Moving Average Convergence Divergence), Bollinger Bands.
Patterns: Head and shoulders, triangles, double tops and bottoms.
Volume Analysis: Evaluates the strength of price movements through traded volumes.
2.4 Advantages
Short-term Trading: Ideal for day traders and swing traders who focus on price movements.
Quick Decision Making: Relies on real-time data, enabling rapid trading decisions.
Pattern Recognition: Helps identify entry and exit points based on historical trends.
2.5 Limitations
Ignores Intrinsic Value: Does not consider company fundamentals or economic factors.
Subjectivity: Interpretation of charts and indicators can vary among analysts.
False Signals: Market noise can generate misleading signals, leading to losses.
3. Understanding Fundamental Analysis
3.1 Definition
Fundamental analysis is a method of evaluating a security by analyzing economic indicators, financial statements, management quality, and industry conditions to determine its intrinsic value. The central premise is that a stock’s price may deviate from its true value in the short term, but it will eventually align with its fundamental worth.
3.2 Key Components
Economic Analysis: Examines macroeconomic indicators such as GDP growth, inflation, interest rates, and employment data to understand market conditions.
Industry Analysis: Evaluates sector-specific trends, competition, regulation, and growth potential.
Company Analysis: Focuses on financial health, including revenue, profits, earnings per share, debt levels, and cash flow.
Qualitative Factors: Includes management quality, brand strength, innovation, and corporate governance.
3.3 Tools and Techniques
Financial Ratios: Price-to-Earnings (P/E), Price-to-Book (P/B), Return on Equity (ROE), Debt-to-Equity ratio.
Discounted Cash Flow (DCF): Estimates the present value of expected future cash flows.
Comparative Analysis: Benchmarks a company against industry peers.
Economic Indicators: Inflation, unemployment rates, and central bank policies.
3.4 Advantages
Long-term Investment Strategy: Helps identify undervalued stocks for buy-and-hold investors.
Focus on Intrinsic Value: Reduces reliance on market sentiment and short-term fluctuations.
Comprehensive View: Evaluates both quantitative and qualitative factors.
3.5 Limitations
Time-Consuming: Requires extensive research and data analysis.
Market Timing Difficulty: Even undervalued stocks may take time to appreciate.
Limited Short-Term Usefulness: Less effective for day traders or short-term speculation.
4. Complementary Use of Both Analyses
Many investors and traders combine technical and fundamental analysis to improve their decision-making. This approach is known as a hybrid or integrated strategy.
4.1 Examples of Integration
Long-Term Investment with Tactical Timing: Fundamental analysis identifies undervalued stocks, while technical analysis determines optimal entry points.
Risk Management: Technical indicators like support and resistance levels help limit downside risk for fundamentally strong investments.
Market Sentiment Adjustment: Technical trends may provide clues about market sentiment, helping fundamental investors avoid short-term volatility.
5. Practical Applications in Different Markets
5.1 Stock Market
Technical Analysis: Used by day traders and swing traders to exploit short-term volatility.
Fundamental Analysis: Used by value investors, pension funds, and mutual funds for portfolio selection.
5.2 Forex Market
Technical analysis dominates due to the forex market’s liquidity and volatility.
Fundamental factors like interest rates and trade balances influence long-term currency trends.
5.3 Commodity Market
Technical patterns help traders predict price swings in commodities like gold, oil, and agricultural products.
Fundamental analysis considers supply-demand factors, geopolitical risks, and macroeconomic indicators.
6. Challenges in Choosing Between the Two
Investor Profile: Short-term traders may find technical analysis more relevant, while long-term investors benefit from fundamental insights.
Market Conditions: Technical analysis thrives in volatile markets; fundamental analysis is effective during stable economic conditions.
Data Availability: Access to accurate and timely financial data can influence the reliability of fundamental analysis.
Conclusion
Both technical and fundamental analysis offer valuable frameworks for making informed investment decisions. While technical analysis emphasizes price action and market trends, fundamental analysis seeks to uncover intrinsic value based on economic and financial data. The choice between the two approaches depends on investment goals, risk tolerance, time horizon, and market context.
For most successful investors, a balanced approach—leveraging fundamental analysis to select strong securities and technical analysis to optimize timing—provides a strategic advantage. Understanding the strengths and limitations of each method allows traders and investors to navigate markets more effectively, manage risks, and capitalize on opportunities.
I built a Buy & Sell Signal Indicator with 85% accuracy.
📈 Get access via DM or
WhatsApp: wa.link/d997q0
Contact - +91 76782 40962
| Email: techncialexpress@gmail.com
| Script Coder | Trader | Investor | From India
📈 Get access via DM or
WhatsApp: wa.link/d997q0
Contact - +91 76782 40962
| Email: techncialexpress@gmail.com
| Script Coder | Trader | Investor | From India
Related publications
Disclaimer
The information and publications are not meant to be, and do not constitute, financial, investment, trading, or other types of advice or recommendations supplied or endorsed by TradingView. Read more in the Terms of Use.