🔍 Technical View
📊 Relative Strength
🎯 Levels to Watch
⚠️ Risk Factors
🏆 Summary
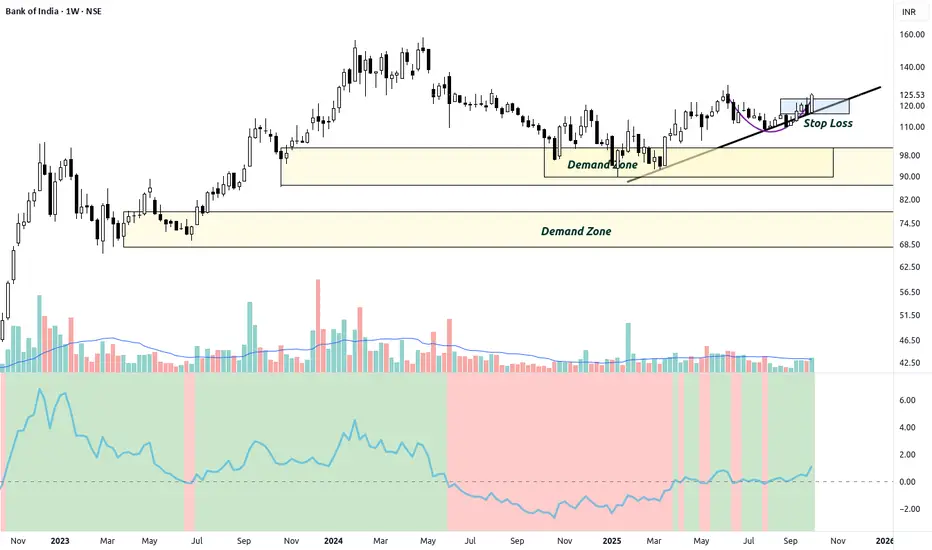
Bank of India is turning the corner technically, with strong structure, healthy volume, and improving relative strength. The setup offers a favorable risk–reward ratio for swing and positional traders eyeing a breakout above key resistance.
- 📈 The stock is forming higher lows on the weekly chart, showing steady accumulation.
- 💪 Recently broke out of a small consolidation with strong volume confirmation — a positive sign of renewed interest.
- 🟢 Trading above key trendline support with clear bullish structure.
- 📦 Multiple demand zones visible below, providing cushion for risk management.
- 🧱 Stop Loss placed below the recent breakout candle keeps risk minimal.
- ⚙️ The cup-like base formation indicates a potential medium-term uptrend if the price sustains above ₹122–125.
📊 Relative Strength
- ✅ Relative strength vs NIFTY has turned positive after a prolonged period of underperformance.
- 📈 Momentum indicator turning up from the zero line — signaling fresh participation.
🎯 Levels to Watch
- Entry Zone: ₹122 – ₹126
- Stop Loss: ₹115
- Target 1: ₹138
- Target 2: ₹150
Extended Target: ₹165+ (if breakout sustains with volume)
⚠️ Risk Factors
- 📉 Failure to hold above ₹115 may lead to retest of lower demand zones.
- 🏦 PSU banking sector volatility could bring short-term whipsaws.
🏆 Summary
Bank of India is turning the corner technically, with strong structure, healthy volume, and improving relative strength. The setup offers a favorable risk–reward ratio for swing and positional traders eyeing a breakout above key resistance.
Disclaimer
The information and publications are not meant to be, and do not constitute, financial, investment, trading, or other types of advice or recommendations supplied or endorsed by TradingView. Read more in the Terms of Use.
Disclaimer
The information and publications are not meant to be, and do not constitute, financial, investment, trading, or other types of advice or recommendations supplied or endorsed by TradingView. Read more in the Terms of Use.