📊 BANKNIFTY TRADING PLAN — 21 NOV 2025
(Reference: 15-min chart structure & mapped intraday zones)
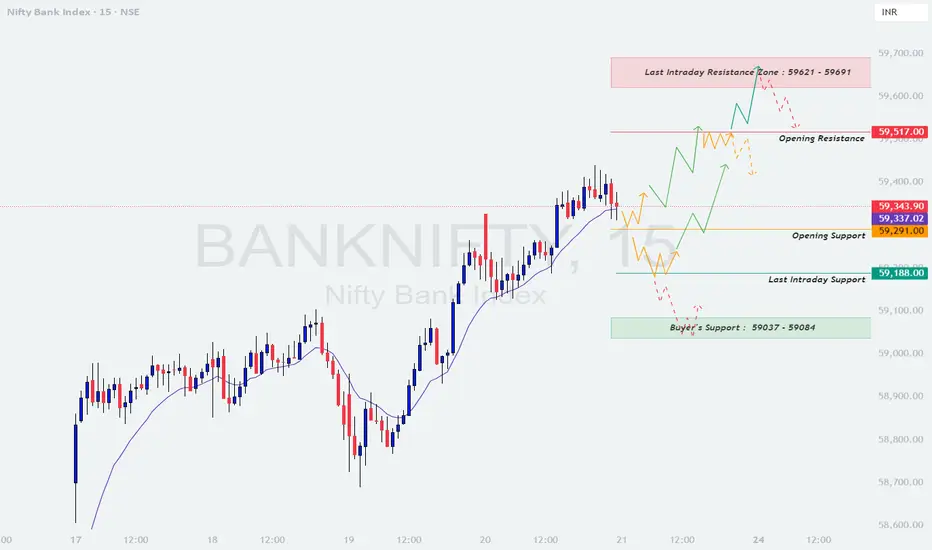
BankNifty closed around 59,343, trading just above Opening Support (59,291) and below the critical Opening Resistance (59,517).
Trend is bullish, but price is consolidating near a supply zone, making open behaviour extremely important.
Here are the major actionable levels for 21 Nov:
🟧 Opening Resistance: 59,517
🟥 Last Intraday Resistance Zone: 59,621 – 59,691
🟩 Opening Support: 59,291
🟦 Last Intraday Support: 59,188
🟩 Buyer’s Support Zone: 59,037 – 59,084 (Trend Reversal Zone)
🟢 SCENARIO 1 — GAP-UP OPENING (200+ points)
If BankNifty opens around 59,500–59,650, price opens directly at or inside resistance areas.
📘 Educational Note:
Gap-ups near resistance zones often fail if the first 5–15 min candle is weak. Always wait for higher-low confirmation before entering longs.
🟧 SCENARIO 2 — FLAT OPENING (Near 59,250–59,350)
A flat open places price between Opening Support (59,291) and Opening Resistance (59,517) — a decision zone.
💡 Educational Tip:
Flat openings are ideal for trend discovery. The first 15-min structure gives the strongest clue—don’t anticipate, let levels break.
🔻 SCENARIO 3 — GAP-DOWN OPENING (200+ points)
If BankNifty opens below 59,150, price enters a crucial demand area.
📘 Educational Note:
Gap-downs into strong demand zones give powerful reversals, but only after confirmation. Never buy falling candles blindly.
💼 RISK MANAGEMENT TIPS FOR OPTION TRADERS 💡
⚠️ Golden Rule:
Survive first, profit second. Capital protection creates consistency.
📌 SUMMARY
Bullish above → 59,517
🎯 Targets → 59,580 → 59,621 → 59,691
Bearish below → 59,291
🎯 Targets → 59,240 → 59,188 → 59,084
Strong Reversal Zone (for bounce trades):
✔️ 59,037 – 59,084
Key No-Trade Zone:
— 59,291 – 59,517 (Flat opening chop area)
🧾 CONCLUSION
BankNifty is at a critical decision point between 59,291–59,517, and the breakout or breakdown from this zone will drive the intraday trend.
The cleanest trades will come from:
✔️ Breakout + Retest above 59,517
✔️ Reversal from 59,037–59,084
✔️ Breakdown + Retest below 59,291
Avoid chop zones, wait for confirmation, and execute with discipline.
⚠️ DISCLAIMER
I am not a SEBI-registered analyst.
This analysis is for educational purposes only.
Please consult a certified financial advisor before making any trading decisions.
(Reference: 15-min chart structure & mapped intraday zones)
BankNifty closed around 59,343, trading just above Opening Support (59,291) and below the critical Opening Resistance (59,517).
Trend is bullish, but price is consolidating near a supply zone, making open behaviour extremely important.
Here are the major actionable levels for 21 Nov:
🟧 Opening Resistance: 59,517
🟥 Last Intraday Resistance Zone: 59,621 – 59,691
🟩 Opening Support: 59,291
🟦 Last Intraday Support: 59,188
🟩 Buyer’s Support Zone: 59,037 – 59,084 (Trend Reversal Zone)
🟢 SCENARIO 1 — GAP-UP OPENING (200+ points)
If BankNifty opens around 59,500–59,650, price opens directly at or inside resistance areas.
- []If price sustains above 59,517 for 10–15 minutes with strong bullish candles →
🎯 Upside targets → 59,621 → 59,691 → 59,750
[]If price enters the Last Intraday Resistance Zone (59,621–59,691), expect:
🔻 Profit booking / intraday reversal
💡 Book long profits here and avoid fresh buys.
[]Rejection from 59,620–59,690 can retrace toward:
➡️ 59,517 → 59,420 → 59,291
[]A bullish retest at 59,517 is a safe re-entry for continuation.
📘 Educational Note:
Gap-ups near resistance zones often fail if the first 5–15 min candle is weak. Always wait for higher-low confirmation before entering longs.
🟧 SCENARIO 2 — FLAT OPENING (Near 59,250–59,350)
A flat open places price between Opening Support (59,291) and Opening Resistance (59,517) — a decision zone.
- []Breakout above 59,517 →
🎯 Targets → 59,580 → 59,621 → 59,691
[]Breakdown below 59,291 →
🎯 Targets → 59,240 → 59,188
[]Avoid trading inside the 59,291–59,517 zone until a clear direction forms.
[]Best strategy:
✔️ Breakout → Retest → Long
✔️ Breakdown → Retest → Short
💡 Educational Tip:
Flat openings are ideal for trend discovery. The first 15-min structure gives the strongest clue—don’t anticipate, let levels break.
🔻 SCENARIO 3 — GAP-DOWN OPENING (200+ points)
If BankNifty opens below 59,150, price enters a crucial demand area.
- []A gap-down near 59,188 (Last Intraday Support):
If price gives bullish wick rejection →
🎯 Targets → 59,240 → 59,291 → 59,337
[]If 59,188 breaks decisively →
Next major demand zone → 59,037 – 59,084 (Buyer’s Support Zone)
[]Expect a strong reversal attempt from 59,037–59,084.
A bullish reversal candle here is a high-probability long setup.
[]If 59,037 breaks →
Downside expansion → 58,950 → 58,880
📘 Educational Note:
Gap-downs into strong demand zones give powerful reversals, but only after confirmation. Never buy falling candles blindly.
💼 RISK MANAGEMENT TIPS FOR OPTION TRADERS 💡
- []Avoid trading during the first 5–10 minutes — high volatility = high risk.
[]For directional trades → Use ATM or ITM options for better decay control.
[]Maintain a fixed SL based on structure, not on emotions.
[]Avoid averaging losers — trend can continue longer than expected.
[]Book partial profits if momentum slows near resistance or support.
[]In low VIX → option buying works well.
In high VIX → prefer spreads or hedged selling. - Trail SL once BankNifty breaks out with momentum.
⚠️ Golden Rule:
Survive first, profit second. Capital protection creates consistency.
📌 SUMMARY
Bullish above → 59,517
🎯 Targets → 59,580 → 59,621 → 59,691
Bearish below → 59,291
🎯 Targets → 59,240 → 59,188 → 59,084
Strong Reversal Zone (for bounce trades):
✔️ 59,037 – 59,084
Key No-Trade Zone:
— 59,291 – 59,517 (Flat opening chop area)
🧾 CONCLUSION
BankNifty is at a critical decision point between 59,291–59,517, and the breakout or breakdown from this zone will drive the intraday trend.
The cleanest trades will come from:
✔️ Breakout + Retest above 59,517
✔️ Reversal from 59,037–59,084
✔️ Breakdown + Retest below 59,291
Avoid chop zones, wait for confirmation, and execute with discipline.
⚠️ DISCLAIMER
I am not a SEBI-registered analyst.
This analysis is for educational purposes only.
Please consult a certified financial advisor before making any trading decisions.
Disclaimer
The information and publications are not meant to be, and do not constitute, financial, investment, trading, or other types of advice or recommendations supplied or endorsed by TradingView. Read more in the Terms of Use.
Disclaimer
The information and publications are not meant to be, and do not constitute, financial, investment, trading, or other types of advice or recommendations supplied or endorsed by TradingView. Read more in the Terms of Use.