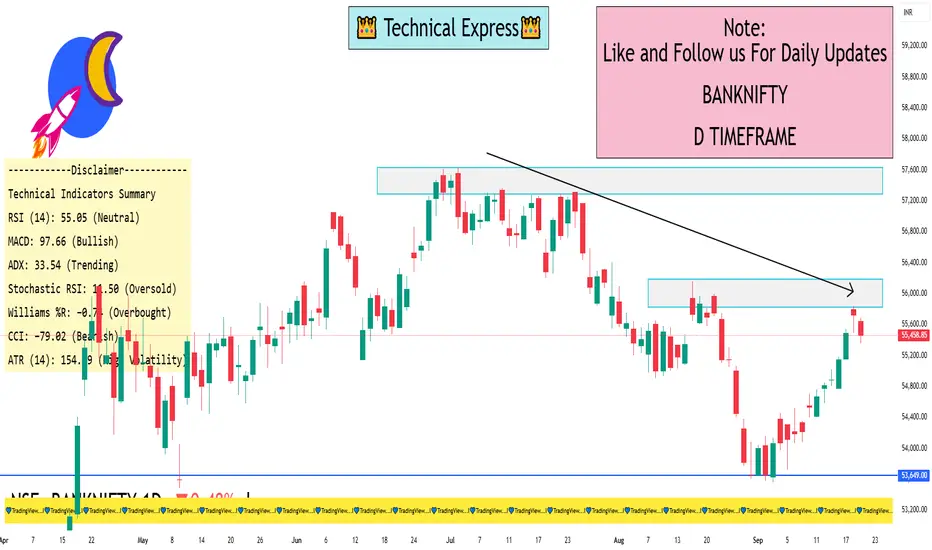
📉 Daily Price Action (Sep 19, 2025)
Closing Price: 55,458.85 (−0.48%)
Open: 55,647.95
High: 55,688.75
Low: 55,355.30
Volume: 190.00M
🔍 Technical Indicators
Relative Strength Index (RSI): Indicates momentum strength.
Moving Average Convergence Divergence (MACD): Shows trend direction and potential reversals.
Stochastic RSI: Assesses overbought or oversold conditions.
Super Trend: Signals the prevailing trend direction.
Parabolic SAR: Highlights potential reversal points.
Chaikin Money Flow (CMF): Measures the accumulation or distribution of money.
Average Directional Index (ADX): Determines trend strength.
🧭 Market Sentiment
The Nifty Bank Index experienced a decline on September 19, 2025, primarily due to profit-booking in major banking stocks, particularly HDFC Bank and ICICI Bank. Despite this, the index remains above the 55,000 level, indicating underlying strength. A sustained move above 55,600 could lead to further upside, while a break below 55,000 might indicate a bearish trend.
I built a Buy & Sell Signal Indicator with 85% accuracy.
📈 Get access via DM or
WhatsApp: wa.link/d997q0
Contact - +91 76782 40962
| Email: techncialexpress@gmail.com
| Script Coder | Trader | Investor | From India
📈 Get access via DM or
WhatsApp: wa.link/d997q0
Contact - +91 76782 40962
| Email: techncialexpress@gmail.com
| Script Coder | Trader | Investor | From India
Related publications
Disclaimer
The information and publications are not meant to be, and do not constitute, financial, investment, trading, or other types of advice or recommendations supplied or endorsed by TradingView. Read more in the Terms of Use.