📊 BANK NIFTY TRADING PLAN – 08-Apr-2025
Chart Timeframe: 15-Minute
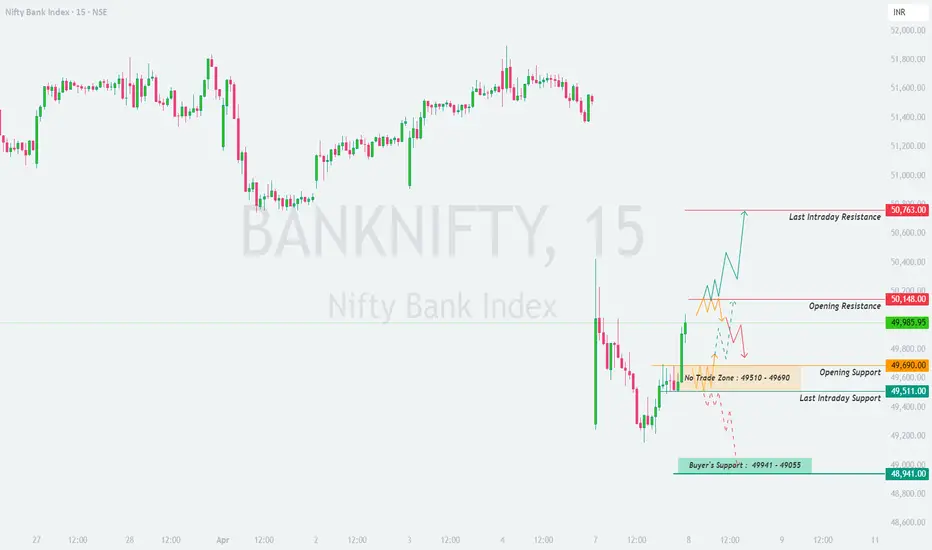
Previous Close: 49,985.95
🔍 Key Zones to Monitor:
🔴 Last Intraday Resistance: 50,763
🟠 Opening Resistance: 50,148
🟡 No Trade Zone: 49,510 – 49,690
🟧 Opening Support: 49,690
🟤 Last Intraday Support: 49,511
🟢 Buyer’s Support Zone: 49,055 – 48,941
🔼 Scenario 1: Gap-Up Opening (200+ points above 50,148)
If Bank Nifty opens above 50,350+, we will be opening above the key Opening Resistance zone and heading toward the Last Intraday Resistance at 50,763.
📌 Plan of Action:
💡 Tip: Gap-up openings near resistance are often traps. Smart traders wait for confirmation rather than entering impulsively.
⚖️ Scenario 2: Flat Opening (Between 49,985 – 50,148)
If the market opens flat or slightly positive near 49,985, we are just below the Opening Resistance. The immediate focus will be on whether price can break and sustain above it.
📌 Plan of Action:
💡 Tip: In flat openings, let the price action build structure. First breakout or breakdown from initial balance often gives the best R:R trade.
🔽 Scenario 3: Gap-Down Opening (200+ points below 49,690)
A gap-down below 49,490 puts the price near Last Intraday Support or even in the Buyers’ Support Zone (49,055 – 48,941).
📌 Plan of Action:
💡 Tip: Gap-downs often trigger panic. Smart traders fade extreme sentiment near strong support zones but always with confirmation and stop loss.
🛡️ Options Trading Risk Management Tips
✅ Avoid Blind Buying of OTM Options: Especially on gap openings. Wait for volatility to settle post 15–30 mins.
✅ Use Spreads to Limit Risk: Bull Call Spreads or Bear Put Spreads reduce theta and vega risks in uncertain zones.
✅ Stick to Defined Stop Loss: Preferably based on 15-minute candle closing, not absolute price.
✅ Keep Position Size in Check: Risk only 1–2% of your capital per trade. Control drawdowns.
✅ Avoid Overtrading Inside No Trade Zone: This zone is for observation, not execution, unless structure develops clearly.
✅ Watch Option Greeks: Stay alert on delta and theta, especially near expiry or IV crush zones.
🧾 Summary & Conclusion
📌 Bullish Above: 50,148 → 50,500 → 50,763
📌 Bearish Below: 49,690 → 49,511 → 49,055
📌 No Trade Zone: 49,510 – 49,690
📌 Buyer’s Strong Support: 49,055 – 48,941
✅ Best Trades Form: After price retests and gives confirmation.
❌ Avoid Emotional Trading: Stick to plan and avoid revenge trades.
⌛ Let the first 15–30 minutes pass: before taking your first trade.
🧘♂️ Patience + Structure = High Probability Trades
⚠️ Disclaimer
I am not a SEBI-registered analyst. All levels, analysis, and trading plans shared here are purely for educational purposes. Please consult your financial advisor before taking any trading decision. Trade at your own risk with proper risk management.
Chart Timeframe: 15-Minute
Previous Close: 49,985.95
🔍 Key Zones to Monitor:
🔴 Last Intraday Resistance: 50,763
🟠 Opening Resistance: 50,148
🟡 No Trade Zone: 49,510 – 49,690
🟧 Opening Support: 49,690
🟤 Last Intraday Support: 49,511
🟢 Buyer’s Support Zone: 49,055 – 48,941
🔼 Scenario 1: Gap-Up Opening (200+ points above 50,148)
If Bank Nifty opens above 50,350+, we will be opening above the key Opening Resistance zone and heading toward the Last Intraday Resistance at 50,763.
📌 Plan of Action:
- [] Wait for price to sustain above 50,148 post-opening. If it consolidates or retests and bounces back, long positions can be initiated with a target toward 50,500 – 50,763.
[] Be cautious near 50,763 – this is a supply zone. Avoid chasing the rally without volume confirmation. Watch for reversal candles like bearish engulfing or shooting stars to go short.
[] If a fake breakout occurs and price closes back below 50,148 on 15-min chart, it may trap bulls — consider shorting toward 49,985 → 49,690.
[] Do not enter trades in the first 15 minutes; wait for confirmation via price action or retest of support/resistance.
💡 Tip: Gap-up openings near resistance are often traps. Smart traders wait for confirmation rather than entering impulsively.
⚖️ Scenario 2: Flat Opening (Between 49,985 – 50,148)
If the market opens flat or slightly positive near 49,985, we are just below the Opening Resistance. The immediate focus will be on whether price can break and sustain above it.
📌 Plan of Action:
- [] Breakout above 50,148 with strength can lead to a move toward 50,500 → 50,763. Enter long only if 15-min candle closes above 50,148 with strong momentum.
[] If price fails to break and sustains below 50,148, it may slip into the No Trade Zone: 49,690 – 49,510. Avoid fresh entries here unless you see clear price structure.
[] Look for a bounce setup from the bottom of the range 49,690 with reversal signs to go long back toward 49,985+.
[] If price breaks and closes below 49,690, short opportunities open toward 49,511 → 49,055.
💡 Tip: In flat openings, let the price action build structure. First breakout or breakdown from initial balance often gives the best R:R trade.
🔽 Scenario 3: Gap-Down Opening (200+ points below 49,690)
A gap-down below 49,490 puts the price near Last Intraday Support or even in the Buyers’ Support Zone (49,055 – 48,941).
📌 Plan of Action:
- [] Monitor price behavior near 49,055 – 48,941 zone. This is a high-probability reversal zone. Look for bullish patterns like hammer or double bottom on 15-min chart to go long.
[] If support breaks decisively below 48,941, avoid buying the dip — price may head toward new lows.
[] Wait for retest and rejection near 49,511 – 49,690 if price attempts to fill the gap. That area becomes strong resistance in case of pullback.
[] Ideal trades are reversal longs from buyer zone or breakdown shorts below 48,941 on confirmation.
💡 Tip: Gap-downs often trigger panic. Smart traders fade extreme sentiment near strong support zones but always with confirmation and stop loss.
🛡️ Options Trading Risk Management Tips
✅ Avoid Blind Buying of OTM Options: Especially on gap openings. Wait for volatility to settle post 15–30 mins.
✅ Use Spreads to Limit Risk: Bull Call Spreads or Bear Put Spreads reduce theta and vega risks in uncertain zones.
✅ Stick to Defined Stop Loss: Preferably based on 15-minute candle closing, not absolute price.
✅ Keep Position Size in Check: Risk only 1–2% of your capital per trade. Control drawdowns.
✅ Avoid Overtrading Inside No Trade Zone: This zone is for observation, not execution, unless structure develops clearly.
✅ Watch Option Greeks: Stay alert on delta and theta, especially near expiry or IV crush zones.
🧾 Summary & Conclusion
📌 Bullish Above: 50,148 → 50,500 → 50,763
📌 Bearish Below: 49,690 → 49,511 → 49,055
📌 No Trade Zone: 49,510 – 49,690
📌 Buyer’s Strong Support: 49,055 – 48,941
✅ Best Trades Form: After price retests and gives confirmation.
❌ Avoid Emotional Trading: Stick to plan and avoid revenge trades.
⌛ Let the first 15–30 minutes pass: before taking your first trade.
🧘♂️ Patience + Structure = High Probability Trades
⚠️ Disclaimer
I am not a SEBI-registered analyst. All levels, analysis, and trading plans shared here are purely for educational purposes. Please consult your financial advisor before taking any trading decision. Trade at your own risk with proper risk management.
Disclaimer
The information and publications are not meant to be, and do not constitute, financial, investment, trading, or other types of advice or recommendations supplied or endorsed by TradingView. Read more in the Terms of Use.
Disclaimer
The information and publications are not meant to be, and do not constitute, financial, investment, trading, or other types of advice or recommendations supplied or endorsed by TradingView. Read more in the Terms of Use.