🏦 BANK NIFTY INDEX – Wedge Pattern Near Resistance | 15-Min Chart
📅 Date: April 28, 2025
📈 Timeframe: 15-Minute
🔍 Index: Bank Nifty (NSE)
📌 Technical Overview:
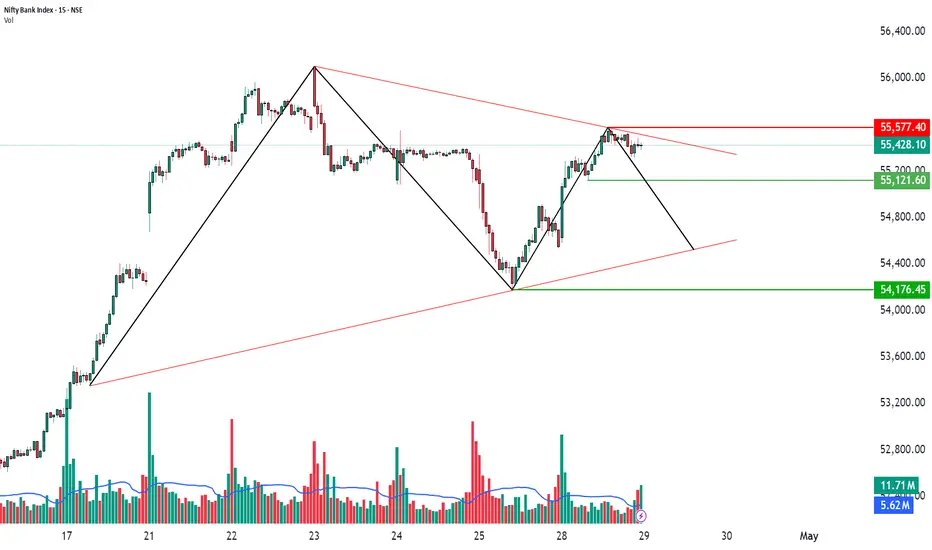
Bank Nifty is moving inside a Wedge Pattern on the 15-minute chart and is facing resistance near 55,577. The price is struggling to move higher and may face selling pressure if it fails to break this resistance. Immediate support is placed at 55,121, and if it breaks down, the index could slip further toward 54,176.
🧩 Chart Pattern Details:
Wedge formation visible with two sloping trendlines (marked in red).
Resistance: 55,577 (red horizontal line).
Immediate Support: 55,121 (first green line).
Major Support: 54,176 (second green line).
🔍 Key Price Levels:
Resistance: 55,577
Immediate Support: 55,121
Major Support: 54,176
CMP (Current Market Price): 55,428.10
If Bank Nifty remains below 55,577 and breaks below 55,121, further downside pressure could build up toward the lower support zone.
📊 Volume Analysis:
Volume has reduced near the resistance area, showing that buyers are losing strength and sellers may start gaining control.
🧠 Observational Bias:
If Bank Nifty fails to cross above 55,577 and breaks 55,121, bears could dominate.
Watch for a proper breakout or breakdown setup before taking trades.
📅 Date: April 28, 2025
📈 Timeframe: 15-Minute
🔍 Index: Bank Nifty (NSE)
📌 Technical Overview:
Bank Nifty is moving inside a Wedge Pattern on the 15-minute chart and is facing resistance near 55,577. The price is struggling to move higher and may face selling pressure if it fails to break this resistance. Immediate support is placed at 55,121, and if it breaks down, the index could slip further toward 54,176.
🧩 Chart Pattern Details:
Wedge formation visible with two sloping trendlines (marked in red).
Resistance: 55,577 (red horizontal line).
Immediate Support: 55,121 (first green line).
Major Support: 54,176 (second green line).
🔍 Key Price Levels:
Resistance: 55,577
Immediate Support: 55,121
Major Support: 54,176
CMP (Current Market Price): 55,428.10
If Bank Nifty remains below 55,577 and breaks below 55,121, further downside pressure could build up toward the lower support zone.
📊 Volume Analysis:
Volume has reduced near the resistance area, showing that buyers are losing strength and sellers may start gaining control.
🧠 Observational Bias:
If Bank Nifty fails to cross above 55,577 and breaks 55,121, bears could dominate.
Watch for a proper breakout or breakdown setup before taking trades.
Trade closed manually
📊 STWP | Mentor | Demand & Supply Specialist
🎯 Helping you become a self-reliant & independent trader
🎓 Learn more: simpletradewithpatience.com
📲 WhatsApp: wa.me/919987567889
🔍 Trade with Clarity. Learn with Patience.
🎯 Helping you become a self-reliant & independent trader
🎓 Learn more: simpletradewithpatience.com
📲 WhatsApp: wa.me/919987567889
🔍 Trade with Clarity. Learn with Patience.
Disclaimer
The information and publications are not meant to be, and do not constitute, financial, investment, trading, or other types of advice or recommendations supplied or endorsed by TradingView. Read more in the Terms of Use.