📊 Bank Nifty Trading Plan – 23-May-2025
Chart Timeframe: 15 Min | Reference Spot Price: 54,963.25
Gap Opening Threshold: 200+ points
🛡️ Options Trading Risk Management Tips
✅ Use ATM or slightly ITM options for better price movement and less theta decay.
✅ Always trade with stop-loss based on spot levels, not option premiums.
✅ Avoid trading in No Trade Zones or during sideways market—wait for breakout or breakdown levels.
✅ Book partial profits near intermediate levels and trail SL to protect gains.
✅ Avoid overleveraging. Limit capital exposure to 1–2% per trade.
✅ Control emotions. Don’t revenge trade after stop-loss hits.
📌 Summary & Conclusion
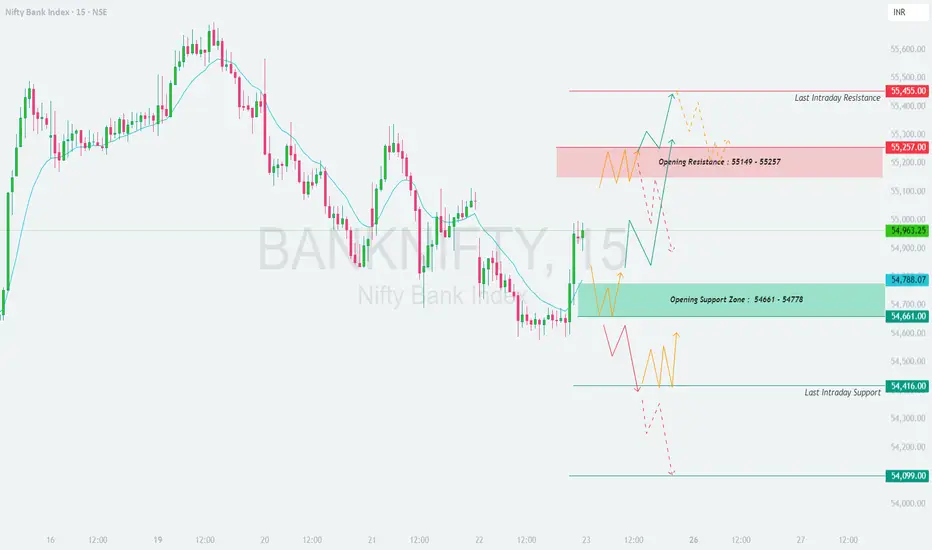
🔹 Opening Resistance Zone: 55,149 – 55,257
🔹 Last Intraday Resistance: 55,455
🔹 Opening Support Zone: 54,661 – 54,778
🔹 Last Support Zone: 54,416
🔹 Deeper Support (Breakdown Only): 54,099
📈 Direction bias will be clear once price exits either support or resistance zone with volume.
⏱️ Wait for first 15–30 minutes before entering trades to avoid false breakouts.
🎯 High probability setups lie near breakout from resistance or breakdown from support.
⚠️ Disclaimer:
I am not a SEBI-registered analyst. This trading plan is shared only for educational and informational purposes. Please consult with a registered financial advisor before making any trading or investment decisions.
Chart Timeframe: 15 Min | Reference Spot Price: 54,963.25
Gap Opening Threshold: 200+ points
- 🚀 Gap-Up Opening (200+ Points Above Previous Close)
If Bank Nifty opens around 55,150+, it will enter directly into the Opening Resistance Zone: 55,149 – 55,257.
🟥 This zone is marked as a high supply area. Price tends to react with either consolidation or reversal due to trapped buyers/sellers from previous sessions.
✅ Plan of Action:
– Avoid aggressive longs right at the open in the resistance zone.
– Wait for a 15-min bullish candle to close above 55,257 for confirmation. This could open the upside to 55,455, the last intraday resistance.
– Bearish rejection patterns (like shooting star, bearish engulfing) in this zone can be used for sell-on-rise trades targeting back to 54,963 or even 54,788.
– Ideal stop loss should be just above 55,300–55,350 zone for short trades.
🎓 Educational Note: Zones like this often act as reversal points for intraday traders. Waiting for confirmation helps avoid traps.
- 📈 Flat Opening (within ±200 Points)
If Bank Nifty opens between 54,770 – 55,100, it opens near the mid-level or inside the indecisive No Trade Area around 54,963.
🟧 This area lacks clear directional bias. Choppiness, fakeouts, and whipsaws are common.
✅ Plan of Action:
– Stay out during the first 15–30 minutes. Observe trend formation.
– If price breaks and sustains above 55,149, it can give a clean move toward 55,257 – 55,455.
– If price slips below 54,788 and sustains, it may revisit Opening Support Zone: 54,661 – 54,778.
– Breakdown of 54,661 opens the gates for testing 54,416, the last intraday support.
🎓 Educational Note: Inside-range opens are often manipulated zones. Avoid premature entries and let price show strength or weakness beyond known key levels.
- 📉 Gap-Down Opening (200+ Points Below Previous Close)
If Bank Nifty opens near or below 54,750, we are entering the critical Opening Support Zone: 54,661 – 54,778.
🟩 This is a demand area where buyers previously supported the market.
✅ Plan of Action:
– Watch price behavior closely near 54,661.
– If bullish reversal patterns (like hammer, bullish engulfing) form and sustain, one can consider a reversal long trade with upside potential to 54,963 and above.
– However, a breakdown and 15-min candle close below 54,661 indicates seller dominance. In that case, target is Last Support: 54,416, and potentially 54,099 if the fall continues.
🎓 Educational Note: Don’t blindly buy dips in support zones. Confirm trend reversal before entering. Always have stop-loss in place.
🛡️ Options Trading Risk Management Tips
✅ Use ATM or slightly ITM options for better price movement and less theta decay.
✅ Always trade with stop-loss based on spot levels, not option premiums.
✅ Avoid trading in No Trade Zones or during sideways market—wait for breakout or breakdown levels.
✅ Book partial profits near intermediate levels and trail SL to protect gains.
✅ Avoid overleveraging. Limit capital exposure to 1–2% per trade.
✅ Control emotions. Don’t revenge trade after stop-loss hits.
📌 Summary & Conclusion
🔹 Opening Resistance Zone: 55,149 – 55,257
🔹 Last Intraday Resistance: 55,455
🔹 Opening Support Zone: 54,661 – 54,778
🔹 Last Support Zone: 54,416
🔹 Deeper Support (Breakdown Only): 54,099
📈 Direction bias will be clear once price exits either support or resistance zone with volume.
⏱️ Wait for first 15–30 minutes before entering trades to avoid false breakouts.
🎯 High probability setups lie near breakout from resistance or breakdown from support.
⚠️ Disclaimer:
I am not a SEBI-registered analyst. This trading plan is shared only for educational and informational purposes. Please consult with a registered financial advisor before making any trading or investment decisions.
Disclaimer
The information and publications are not meant to be, and do not constitute, financial, investment, trading, or other types of advice or recommendations supplied or endorsed by TradingView. Read more in the Terms of Use.
Disclaimer
The information and publications are not meant to be, and do not constitute, financial, investment, trading, or other types of advice or recommendations supplied or endorsed by TradingView. Read more in the Terms of Use.