📊 BANKNIFTY TRADING PLAN — 09 DEC 2025
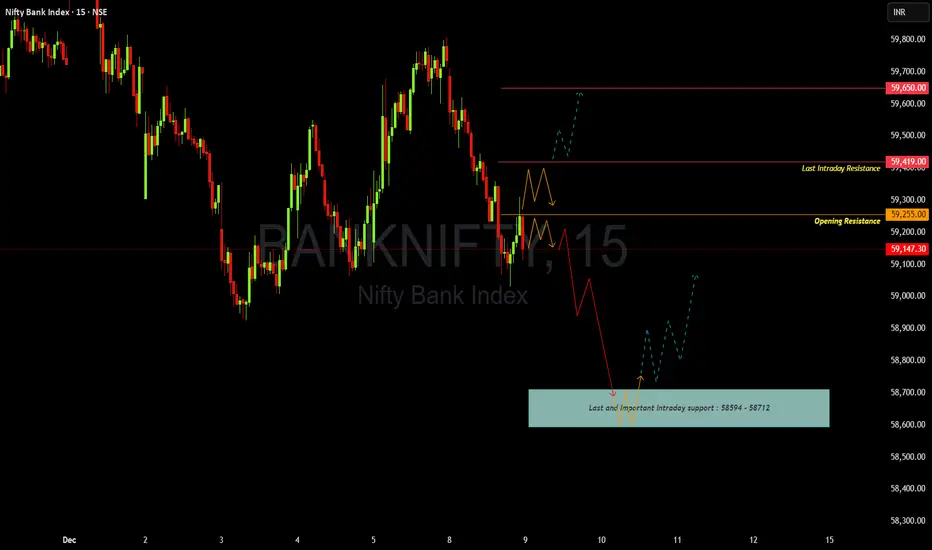
BankNifty closed around 59,147, sitting just below the Opening Resistance (59,255) and well below Last Intraday Resistance (59,419).
Downside includes a major liquidity pocket:
Last & Important Intraday Support: 58,594 – 58,712
Tomorrow’s opening reaction at these key levels will dictate trend continuation or reversal.
Key Levels from the chart:
• Opening Resistance: 59,255
• Last Intraday Resistance: 59,419
• Major Resistance: 59,650
• Major Support Zone: 58,594 – 58,712
🚀 1. GAP-UP OPENING (200+ points)
A gap-up above 59,350–59,400 puts BankNifty directly near the resistance cluster.
📌 Educational Note:
Gap-ups often test nearby resistance first. Retests offer the safest way to enter trending moves.
⚖ 2. FLAT OPENING (±70 pts around 59,150)
Flat openings allow for clean structural setups.
📌 Educational Note:
Flat opens reveal market intent through early candle structure. Let the market show its direction—avoid guessing.
📉 3. GAP-DOWN OPENING (200+ points)
A gap-down near 58,900–58,850 brings price closer to the big buyer zone.
📌 Educational Note:
Aggressive selling during gap-downs often sweeps liquidity before sharp reversals. Trade based on confirmation, not assumptions.
🛡 RISK MANAGEMENT TIPS FOR OPTIONS TRADERS
📌 SUMMARY & CONCLUSION
• Bullish bias only above 59,255, with targets toward 59,419 → 59,650.
• Choppy zone expected between 59,147–59,255.
• Major downside reversal area: 58,594–58,712 (strong buyer zone).
• Always wait for breakout + retest for clean entries.
• Maintain disciplined risk management—levels are your guide.
⚠ DISCLAIMER
I am not a SEBI-registered analyst.
This plan is for educational purposes only and must not be considered investment advice.
Market behaviour can change rapidly — always use your own judgment and proper risk management.
BankNifty closed around 59,147, sitting just below the Opening Resistance (59,255) and well below Last Intraday Resistance (59,419).
Downside includes a major liquidity pocket:
Last & Important Intraday Support: 58,594 – 58,712
Tomorrow’s opening reaction at these key levels will dictate trend continuation or reversal.
Key Levels from the chart:
• Opening Resistance: 59,255
• Last Intraday Resistance: 59,419
• Major Resistance: 59,650
• Major Support Zone: 58,594 – 58,712
🚀 1. GAP-UP OPENING (200+ points)
A gap-up above 59,350–59,400 puts BankNifty directly near the resistance cluster.
1. If price opens above 59,255 and retests it successfully
• Do NOT chase the gap-up.
• Wait for a retest of 59,255 with bullish reaction (wick rejections, CHoCH, engulfing).
• Once confirmed → Long entry toward 59,419 → 59,650.
• Book partial profits at 59,419 due to historical resistance.
2. If price opens directly inside 59,419 (Last Intraday Resistance)
• High chance of rejection and profit booking.
• Avoid fresh longs here.
• Look for rejection patterns → Short entries valid only if price falls back below 59,255.
• Targets: 59,147 → 59,000.
3. If breakout sustains above 59,650
• Signals strong trending day.
• Next targets open toward 59,800–59,900.
• Trail stop-loss aggressively to protect gains.
📌 Educational Note:
Gap-ups often test nearby resistance first. Retests offer the safest way to enter trending moves.
⚖ 2. FLAT OPENING (±70 pts around 59,150)
Flat openings allow for clean structural setups.
1. If price reclaims 59,255 and sustains
• Buyers show control above this level.
• Long setups activate after breakout + retest.
• Targets: 59,419 → 59,650.
2. If price rejects 59,255
• Bearish rejection = lower-high structure.
• Short setups valid toward 59,147 → 59,000.
3. Break below 59,147 (LTP area)
• Trend pressure shifts bearish.
• Next downside targets: 58,900 → 58,712.
📌 Educational Note:
Flat opens reveal market intent through early candle structure. Let the market show its direction—avoid guessing.
📉 3. GAP-DOWN OPENING (200+ points)
A gap-down near 58,900–58,850 brings price closer to the big buyer zone.
1. If price opens near 58,900 and holds above it
• Expect initial volatility but avoid panic.
• Look for reversal patterns → If confirmed → Long toward 59,000 → 59,147.
2. If price opens inside the Major Support Zone (58,594–58,712)
• This is the strongest demand region on the chart.
• Never short inside this zone.
• Look for reversal signs (hammer, bullish engulfing, CHoCH).
• If reversal confirmed → Long toward 58,900 → 59,147 → 59,255.
3. If price breaks below 58,594 with strong momentum
• Do NOT enter immediately — wait for a retest.
• If retest rejects → Short continuation toward 58,450–58,400.
• Trend becomes bearish for the day.
📌 Educational Note:
Aggressive selling during gap-downs often sweeps liquidity before sharp reversals. Trade based on confirmation, not assumptions.
🛡 RISK MANAGEMENT TIPS FOR OPTIONS TRADERS
1. Avoid trading the first 5 minutes after big gap opens.
Premiums behave erratically.
2. Do NOT buy deep OTM options after a big gap-up or gap-down.
IV crush + theta decay = rapid losses.
3. Always use price-level-based stop losses, not premium-based SL.
4. Follow strict risk-per-trade:
Risk only 1–2% of trading capital.
5. High IV → favour option selling (credit spreads, iron condors).
Low IV → option buying becomes more efficient.
6. Book partial profits near major zones:
59,255 / 59,419 / 59,650
7. Avoid revenge trading.
Protect capital before chasing profits.
📌 SUMMARY & CONCLUSION
• Bullish bias only above 59,255, with targets toward 59,419 → 59,650.
• Choppy zone expected between 59,147–59,255.
• Major downside reversal area: 58,594–58,712 (strong buyer zone).
• Always wait for breakout + retest for clean entries.
• Maintain disciplined risk management—levels are your guide.
⚠ DISCLAIMER
I am not a SEBI-registered analyst.
This plan is for educational purposes only and must not be considered investment advice.
Market behaviour can change rapidly — always use your own judgment and proper risk management.
Disclaimer
The information and publications are not meant to be, and do not constitute, financial, investment, trading, or other types of advice or recommendations supplied or endorsed by TradingView. Read more in the Terms of Use.
Disclaimer
The information and publications are not meant to be, and do not constitute, financial, investment, trading, or other types of advice or recommendations supplied or endorsed by TradingView. Read more in the Terms of Use.