BANK NIFTY TRADING PLAN – 16-Sep-2025
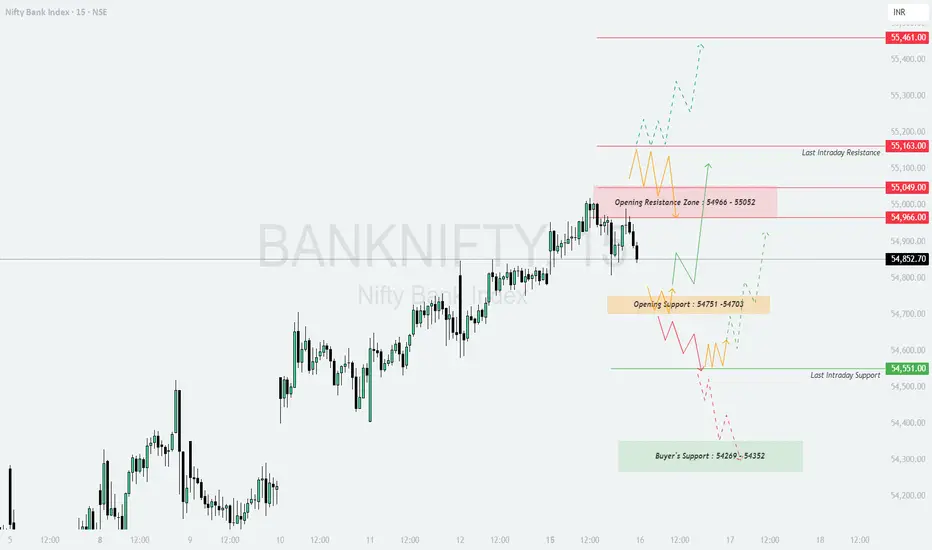
📊 Spot Price (Previous Close): 54,852
🔑 Key Levels from Chart:
Opening Resistance Zone: 54,966 – 55,052
Last Intraday Resistance: 55,163
Major Resistance: 55,461
Opening Support Zone: 54,751 – 54,703
Last Intraday Support: 54,551
Buyer’s Support Zone: 54,269 – 54,352
🔹 Scenario 1: Gap-Up Opening (200+ Points above 54,966)
📌 Educational Note: Gap-ups near resistance zones often face selling pressure. Always wait for confirmation candles before entering long trades.
🚨 Risk Tip: Instead of buying naked calls at higher premiums, prefer Bull Call Spreads (Buy ATM call + Sell OTM call) to reduce risk.
🔹 Scenario 2: Flat Opening (Between 54,703 – 54,966)
📌 Educational Note: Flat opens usually trap impatient traders. Observing the first 30 minutes helps in identifying genuine breakouts or breakdowns.
🚨 Risk Tip: Trade with small position sizing in flat zones. Scale up only after clear directional breakout.
🔹 Scenario 3: Gap-Down Opening (200+ Points below 54,551)
📌 Educational Note: Gap-downs near strong supports often create volatile intraday moves. Avoid panic selling; wait for confirmation before shorting.
🚨 Risk Tip: Use Bear Put Spreads (Buy ATM put + Sell lower strike put) instead of naked put buying to hedge against sudden short-covering rallies.
📝 Summary & Conclusion
Bullish above: 54,966 → Targets: 55,052 / 55,163 / 55,461
Neutral Zone: 54,703 – 54,966 → Choppy range, wait for breakout.
Bearish below: 54,551 → Downside targets: 54,352 / 54,269
📌 The market is currently at a crucial resistance zone. A clean breakout above 54,966 – 55,052 can extend bullish momentum, while a breakdown below 54,551 may shift trend to bearish.
💡 Options Tip: For directional trades, prefer ATM/ITM options for higher delta. In uncertain zones, adopt spreads (Bull Call / Bear Put) instead of naked options to minimize theta decay.
⚠️ Disclaimer: I am not a SEBI-registered analyst. This plan is prepared purely for educational purposes. Please do your own research or consult a financial advisor before making trading decisions.
📊 Spot Price (Previous Close): 54,852
🔑 Key Levels from Chart:
Opening Resistance Zone: 54,966 – 55,052
Last Intraday Resistance: 55,163
Major Resistance: 55,461
Opening Support Zone: 54,751 – 54,703
Last Intraday Support: 54,551
Buyer’s Support Zone: 54,269 – 54,352
🔹 Scenario 1: Gap-Up Opening (200+ Points above 54,966)
- [] If Bank Nifty opens with strength above 54,966, it directly tests the Opening Resistance Zone (54,966 – 55,052).
[] A strong breakout and hourly close above this zone may push prices toward 55,163, which is the last intraday resistance.
[] If bullish momentum continues, an extended move toward the 55,461 major resistance is possible.
[] On the flip side, rejection from 55,052 can cause a pullback toward 54,966, which then acts as support.
📌 Educational Note: Gap-ups near resistance zones often face selling pressure. Always wait for confirmation candles before entering long trades.
🚨 Risk Tip: Instead of buying naked calls at higher premiums, prefer Bull Call Spreads (Buy ATM call + Sell OTM call) to reduce risk.
🔹 Scenario 2: Flat Opening (Between 54,703 – 54,966)
- [] A flat open in this range suggests indecision, where both buyers and sellers will try to dominate.
[] A breakout above 54,966 can trigger bullish momentum toward 55,052 → 55,163, and possibly higher levels.
[] On the downside, if price slips below 54,751 – 54,703 support zone, it may test the 54,551 last intraday support.
[] Sustained trading in this zone without breakout may lead to sideways price action.
📌 Educational Note: Flat opens usually trap impatient traders. Observing the first 30 minutes helps in identifying genuine breakouts or breakdowns.
🚨 Risk Tip: Trade with small position sizing in flat zones. Scale up only after clear directional breakout.
🔹 Scenario 3: Gap-Down Opening (200+ Points below 54,551)
- [] A sharp gap-down below 54,551 will put immediate pressure on bulls.
[] If this level fails, prices may slide toward the Buyer’s Support Zone (54,269 – 54,352).
[] A breakdown below 54,269 can intensify selling and invite deeper corrections.
[] However, if Bank Nifty finds support near 54,352 – 54,269 and rebounds, a pullback rally toward 54,551 may occur.
📌 Educational Note: Gap-downs near strong supports often create volatile intraday moves. Avoid panic selling; wait for confirmation before shorting.
🚨 Risk Tip: Use Bear Put Spreads (Buy ATM put + Sell lower strike put) instead of naked put buying to hedge against sudden short-covering rallies.
📝 Summary & Conclusion
Bullish above: 54,966 → Targets: 55,052 / 55,163 / 55,461
Neutral Zone: 54,703 – 54,966 → Choppy range, wait for breakout.
Bearish below: 54,551 → Downside targets: 54,352 / 54,269
📌 The market is currently at a crucial resistance zone. A clean breakout above 54,966 – 55,052 can extend bullish momentum, while a breakdown below 54,551 may shift trend to bearish.
💡 Options Tip: For directional trades, prefer ATM/ITM options for higher delta. In uncertain zones, adopt spreads (Bull Call / Bear Put) instead of naked options to minimize theta decay.
⚠️ Disclaimer: I am not a SEBI-registered analyst. This plan is prepared purely for educational purposes. Please do your own research or consult a financial advisor before making trading decisions.
Disclaimer
The information and publications are not meant to be, and do not constitute, financial, investment, trading, or other types of advice or recommendations supplied or endorsed by TradingView. Read more in the Terms of Use.
Disclaimer
The information and publications are not meant to be, and do not constitute, financial, investment, trading, or other types of advice or recommendations supplied or endorsed by TradingView. Read more in the Terms of Use.