📈 BANKNIFTY – On the Edge of Breakdown | Option Chain + Price Action Analysis
🕒 Chart Type: 15-Minute
📆 Date: July 3, 2025
🔍 What’s Catching Our Eye:
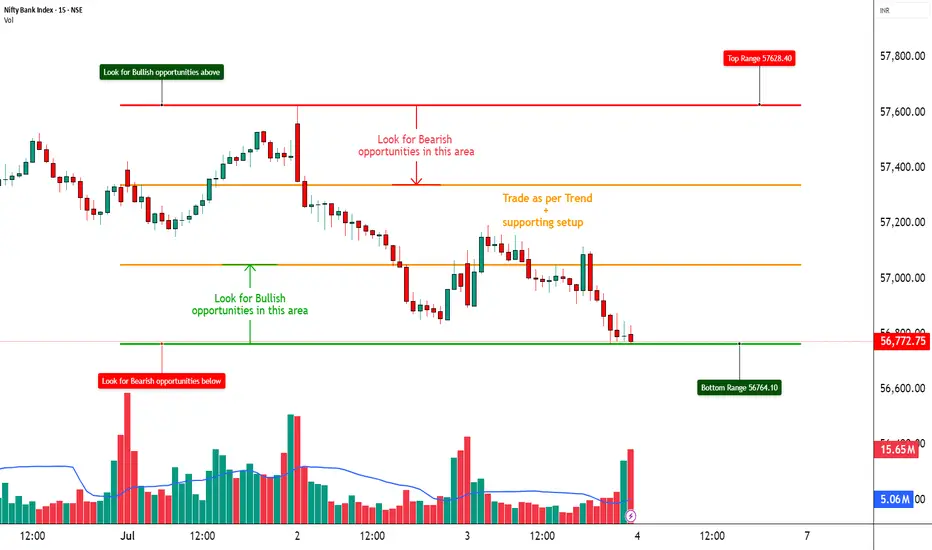
BANKNIFTY is sitting dangerously close to the ₹56,770 support zone, which has been tested multiple times. Price action remains weak, and failure to bounce indicates rising pressure on this level.
📌 What We’re Watching For:
We’re closely monitoring the price action near ₹56,770 — a breakdown below this key level could trigger a sharp pick-up in bearish momentum. On the flip side, any meaningful reversal setup will only be considered valid if BANKNIFTY reclaims ₹57,100 with a strong bullish candlestick supported by volume. As of now, the option chain data continues to heavily favor the bears, offering more confirmation than speculation for a potential downside move.
📊 Volume Footprint:
The current volume stands at 149.89M, slightly lower than the previous session’s 162.75M, indicating a mild drop in participation. This suggests that traders are in a wait-and-watch mode. A sharp surge in volume—especially on a move below ₹56,770—could validate a breakdown and trigger momentum on the downside.
📈 Option Chain Highlights:
The 57000 PE is showing a strong long build-up, signaling that traders are positioning for further downside. On the other hand, the 57000 CE has witnessed a heavy short build-up, reinforcing the bearish sentiment. Additionally, lower strike PEs between 56700 and 56900 are also displaying long build-up, further confirming downside pressure. Meanwhile, Call OI is increasing at higher strikes, indicating that resistance is likely forming in the 56900–57200 range.
🔁 Trend Bias:
🔴 Bearish unless we reclaim and sustain above ₹57,100 with confirmation
🧠 Trade Logic / Reasoning:
There is a visible and well-established supply zone between ₹57,400 and ₹57,600, which has consistently capped upside attempts. On the downside, the ₹56,770 support is showing signs of exhaustion due to repeated tests. Derivative data continues to favor the sellers, with strong bearish positioning in the option chain. As there is no visible sign of a reversal yet, it's prudent to remain cautious on taking any premature long positions.
📍 Important Levels to Mark:
🔺 Top Range: 57,600 - Look for breakout or reversal candlestick pattern + volume
🔻 Bottom Range: 56,770 - Watch for breakdown or bullish reversal pattern + volume
🎯 Trade Plan (Educational Purpose Only):
✅ Best Sell: 57000 PE – Long Build-Up present, indicating institutional downside play
✅ Best Buy: 56500 CE – if reversal above 57,100 is confirmed with price action
🟢 Demand Zone: NA
🔴 Supply Zone: NA
⚠️ Invalidation Below:
Any bullish view becomes invalid if BANKNIFTY breaks and holds below 56,750 with high volume
⚠️ Disclaimer:
This post is for educational purposes only.
STWP is not a SEBI-registered advisor.
This is not a buy/sell recommendation.
Please consult your financial advisor before trading.
STWP is not responsible for any trading outcomes.
💬 Found this helpful?
Drop your thoughts in the comments ⬇️
🔁 Share with fellow traders
✅ Follow STWP for zone-based price action & option chain insights
🚀 Let’s boost awareness of smart & patient trading!
🕒 Chart Type: 15-Minute
📆 Date: July 3, 2025
🔍 What’s Catching Our Eye:
BANKNIFTY is sitting dangerously close to the ₹56,770 support zone, which has been tested multiple times. Price action remains weak, and failure to bounce indicates rising pressure on this level.
📌 What We’re Watching For:
We’re closely monitoring the price action near ₹56,770 — a breakdown below this key level could trigger a sharp pick-up in bearish momentum. On the flip side, any meaningful reversal setup will only be considered valid if BANKNIFTY reclaims ₹57,100 with a strong bullish candlestick supported by volume. As of now, the option chain data continues to heavily favor the bears, offering more confirmation than speculation for a potential downside move.
📊 Volume Footprint:
The current volume stands at 149.89M, slightly lower than the previous session’s 162.75M, indicating a mild drop in participation. This suggests that traders are in a wait-and-watch mode. A sharp surge in volume—especially on a move below ₹56,770—could validate a breakdown and trigger momentum on the downside.
📈 Option Chain Highlights:
The 57000 PE is showing a strong long build-up, signaling that traders are positioning for further downside. On the other hand, the 57000 CE has witnessed a heavy short build-up, reinforcing the bearish sentiment. Additionally, lower strike PEs between 56700 and 56900 are also displaying long build-up, further confirming downside pressure. Meanwhile, Call OI is increasing at higher strikes, indicating that resistance is likely forming in the 56900–57200 range.
🔁 Trend Bias:
🔴 Bearish unless we reclaim and sustain above ₹57,100 with confirmation
🧠 Trade Logic / Reasoning:
There is a visible and well-established supply zone between ₹57,400 and ₹57,600, which has consistently capped upside attempts. On the downside, the ₹56,770 support is showing signs of exhaustion due to repeated tests. Derivative data continues to favor the sellers, with strong bearish positioning in the option chain. As there is no visible sign of a reversal yet, it's prudent to remain cautious on taking any premature long positions.
📍 Important Levels to Mark:
🔺 Top Range: 57,600 - Look for breakout or reversal candlestick pattern + volume
🔻 Bottom Range: 56,770 - Watch for breakdown or bullish reversal pattern + volume
🎯 Trade Plan (Educational Purpose Only):
✅ Best Sell: 57000 PE – Long Build-Up present, indicating institutional downside play
✅ Best Buy: 56500 CE – if reversal above 57,100 is confirmed with price action
🟢 Demand Zone: NA
🔴 Supply Zone: NA
⚠️ Invalidation Below:
Any bullish view becomes invalid if BANKNIFTY breaks and holds below 56,750 with high volume
⚠️ Disclaimer:
This post is for educational purposes only.
STWP is not a SEBI-registered advisor.
This is not a buy/sell recommendation.
Please consult your financial advisor before trading.
STWP is not responsible for any trading outcomes.
💬 Found this helpful?
Drop your thoughts in the comments ⬇️
🔁 Share with fellow traders
✅ Follow STWP for zone-based price action & option chain insights
🚀 Let’s boost awareness of smart & patient trading!
📊 STWP | Mentor | Demand & Supply Specialist
🎯 Helping you become a self-reliant & independent trader
🎓 Learn more: simpletradewithpatience.com
📲 WhatsApp: wa.me/919987567889
🔍 Trade with Clarity. Learn with Patience.
🎯 Helping you become a self-reliant & independent trader
🎓 Learn more: simpletradewithpatience.com
📲 WhatsApp: wa.me/919987567889
🔍 Trade with Clarity. Learn with Patience.
Disclaimer
The information and publications are not meant to be, and do not constitute, financial, investment, trading, or other types of advice or recommendations supplied or endorsed by TradingView. Read more in the Terms of Use.