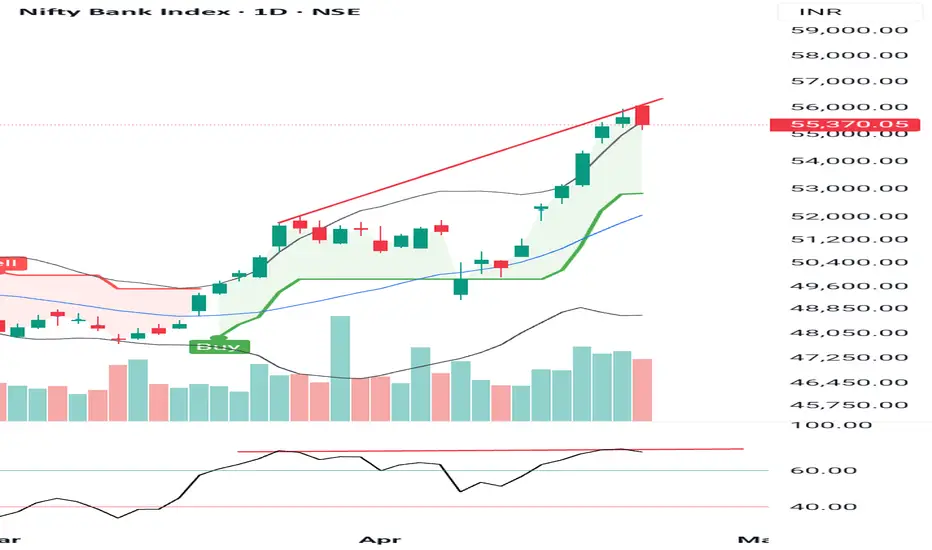
Bank nifty is forming a Negative RSI divergence on daily chart with Bearish Engulfing pattern
Bearish Engulfing pattern formed is a perfect text book case
Seems as if fuel of short covering is getting exhausted and index may see some profit booking or consolidation, even a mild retracement also can't be ruled out
Caution: RSI on all time frames ( D/W/M)is above 60
Lets see how it evolves from here further
Disclaimer: NOT A BUY / SELL RECOMMENDATION I am not an expert I just share interesting charts here for educational purpose and not to be taken as buy/sell recommendation. Please seek expert opinion before investing and trading as trading/ investing in market is subject to market risks. I do not hold any position in the index as on date but I may look to take some position with my own Risk Reward matrix.
Disclaimer
The information and publications are not meant to be, and do not constitute, financial, investment, trading, or other types of advice or recommendations supplied or endorsed by TradingView. Read more in the Terms of Use.
Disclaimer
The information and publications are not meant to be, and do not constitute, financial, investment, trading, or other types of advice or recommendations supplied or endorsed by TradingView. Read more in the Terms of Use.