🔍 Current Market Snapshot
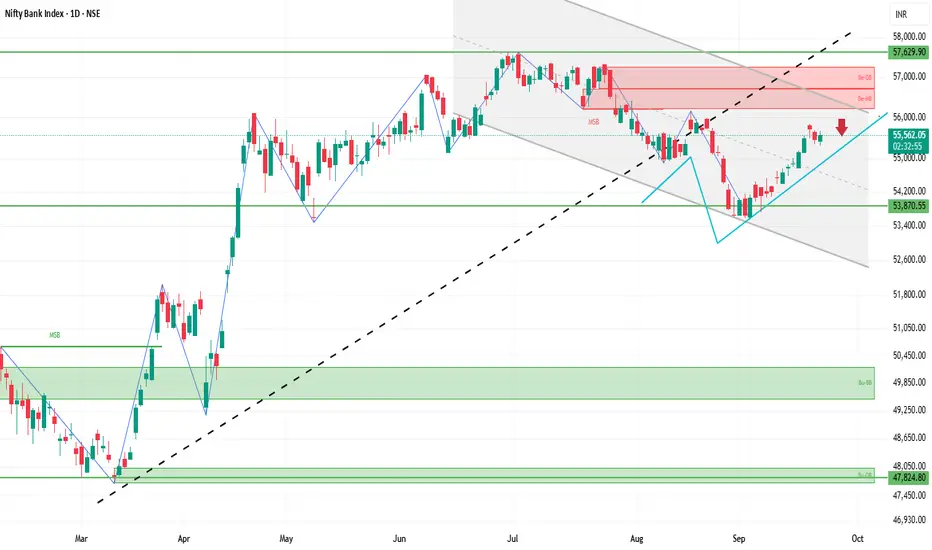
Current Level: ₹55,541.30
Day’s Range: ₹55,315.55 – ₹55,666.35
52-Week Range: ₹47,702.90 – ₹57,628.40
Previous Close: ₹55,458.85
Market Sentiment: Neutral to mildly bearish
📊 Technical Indicators
Moving Averages: The BANKNIFTY index is trading slightly below its short-term moving averages, indicating potential resistance.
RSI (14): Approximately 50, suggesting a neutral stance with no clear overbought or oversold conditions.
MACD: Neutral, with the MACD line and signal line close together, indicating indecision in market momentum.
Stochastic Oscillator: Neutral, fluctuating around the midline, reflecting a lack of strong directional movement.
🧮 Strategy / Trade Ideas
Long Setup:
Entry: Consider entering near support levels (~₹55,300) if bullish reversal signals appear.
Stop Loss: Place below ₹54,800 to manage risk.
Target: First resistance around ₹55,800, then ₹56,200.
Short Setup:
Entry: If price fails to break above resistance (~₹55,800) and shows signs of reversal.
Stop Loss: Above ₹56,300.
Target: Downside toward ₹55,300, then ₹54,800.
Related publications
Disclaimer
The information and publications are not meant to be, and do not constitute, financial, investment, trading, or other types of advice or recommendations supplied or endorsed by TradingView. Read more in the Terms of Use.
Related publications
Disclaimer
The information and publications are not meant to be, and do not constitute, financial, investment, trading, or other types of advice or recommendations supplied or endorsed by TradingView. Read more in the Terms of Use.