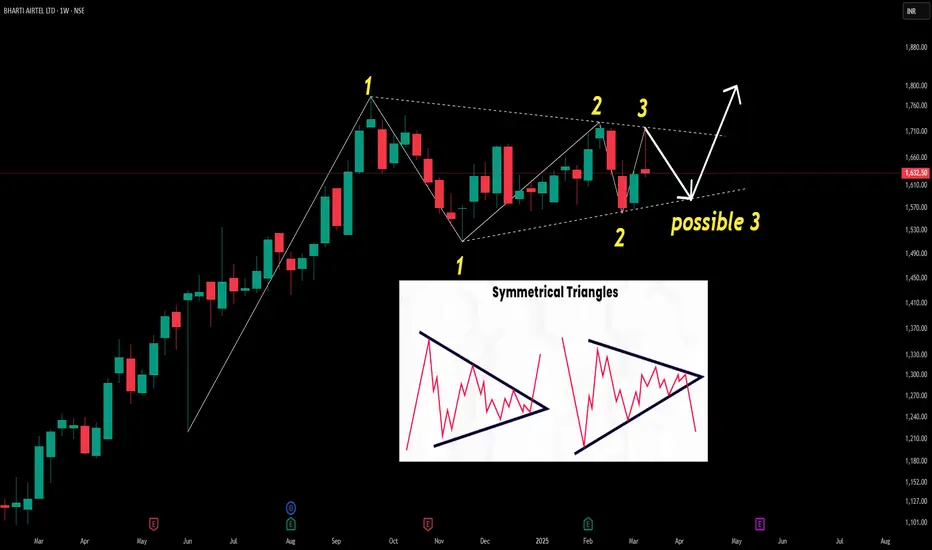
This weekly candlestick chart highlights a symmetrical triangle pattern, a classic signal of potential breakout opportunities. With key points marked (1, 2, 3), traders can analyze possible breakout directions for informed decisions.
harti Airtel Ltd., incorporated in the year 1995, is a Large Cap company (having a market cap of Rs 9,93,885.70 Crore) operating in Telecommunications sector.
Bharti Airtel Ltd. key Products/Revenue Segments include Service Revenue and Sale of Products for the year ending 31-Mar-2024.
For the quarter ended 31-12-2024, the company has reported a Consolidated Total Income of Rs 45,599.00 Crore, up 9.28 % from last quarter Total Income of Rs 41,728.00 Crore and up 18.94 % from last year same quarter Total Income of Rs 38,339.30 Crore. Company has reported net profit after tax of Rs 14,474.90 Crore in latest quarter.
Sucrit.D.Patil
Disclaimer
The information and publications are not meant to be, and do not constitute, financial, investment, trading, or other types of advice or recommendations supplied or endorsed by TradingView. Read more in the Terms of Use.
Sucrit.D.Patil
Disclaimer
The information and publications are not meant to be, and do not constitute, financial, investment, trading, or other types of advice or recommendations supplied or endorsed by TradingView. Read more in the Terms of Use.