Hey guys, just made another research on the fractals of Bitcoin, and here is what I've found.
This chart represents similar price action look from 2013 price action approx from $2.00 to $160.00+ (x80)
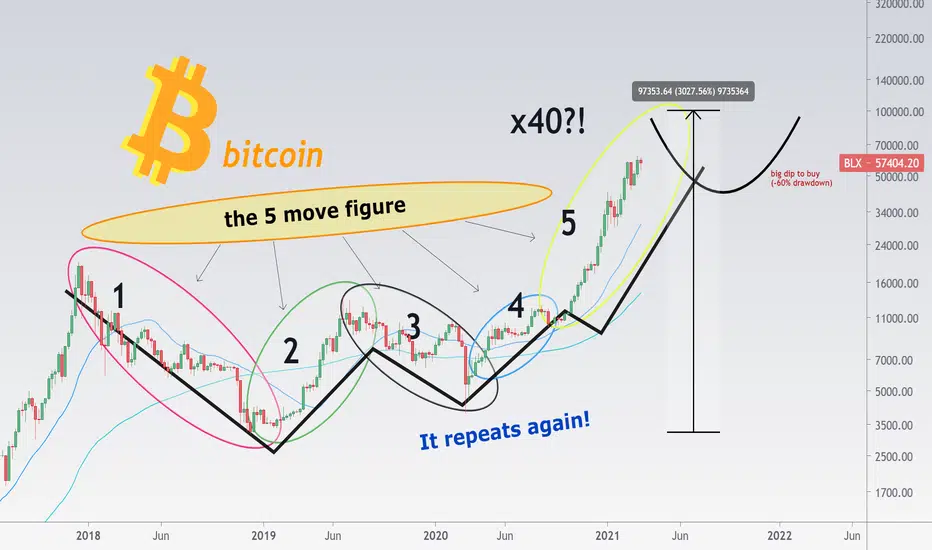
This move was made from 5 phases, where
Phase 1 - crash pattern
Phase 2 - rebound pattern
Phase 3 - consolidation
Phase 4 - recovery
Phase 5 - growth
2013 chart with all phases:

It is amazing how it looks compared to now! it is almost 100% same look and price action setups. Check it out
What is interesting is after 5-th phase, it comes into big dip (correction) with -60% drawdown. Then price pumped x5. Seems like it would be nice opportunity if price action during 2021/22 will repeat all this process in same manner. Hoping for best here!
Remember this is not trading setup, this chart is only a refference for Possbile market look.
Check my other Trading ideas for btc:


Thanks for attention,
Best regards
Artem Shevelev
This chart represents similar price action look from 2013 price action approx from $2.00 to $160.00+ (x80)
This move was made from 5 phases, where
Phase 1 - crash pattern
Phase 2 - rebound pattern
Phase 3 - consolidation
Phase 4 - recovery
Phase 5 - growth
2013 chart with all phases:
It is amazing how it looks compared to now! it is almost 100% same look and price action setups. Check it out
What is interesting is after 5-th phase, it comes into big dip (correction) with -60% drawdown. Then price pumped x5. Seems like it would be nice opportunity if price action during 2021/22 will repeat all this process in same manner. Hoping for best here!
Remember this is not trading setup, this chart is only a refference for Possbile market look.
Check my other Trading ideas for btc:
Thanks for attention,
Best regards
Artem Shevelev
Disclaimer
The information and publications are not meant to be, and do not constitute, financial, investment, trading, or other types of advice or recommendations supplied or endorsed by TradingView. Read more in the Terms of Use.
Disclaimer
The information and publications are not meant to be, and do not constitute, financial, investment, trading, or other types of advice or recommendations supplied or endorsed by TradingView. Read more in the Terms of Use.