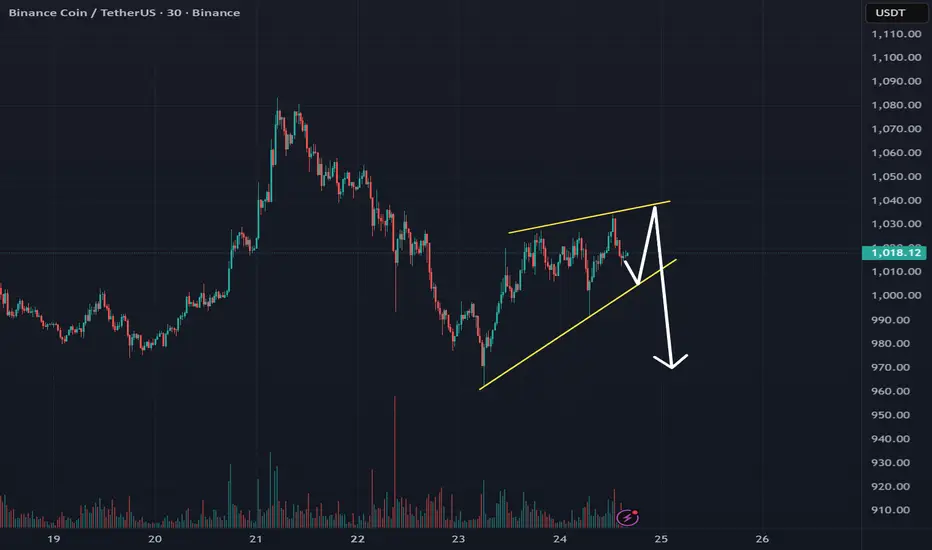
BNB is forming a bearish wedge pattern on the 15-minute chart
This pattern is bearish and formed within the boundaries of a global bearish flag pattern
Current price: $1016
According to the movement within the local wedge, a downward breakout is expected.
The price may reach $1000 and below
Within the pattern, false breakouts to $1050 are possible
---
More detailed analysis, additional charts, and key levels to watch are available on our website
Disclaimer
The information and publications are not meant to be, and do not constitute, financial, investment, trading, or other types of advice or recommendations supplied or endorsed by TradingView. Read more in the Terms of Use.
Disclaimer
The information and publications are not meant to be, and do not constitute, financial, investment, trading, or other types of advice or recommendations supplied or endorsed by TradingView. Read more in the Terms of Use.