📊 Market Structure
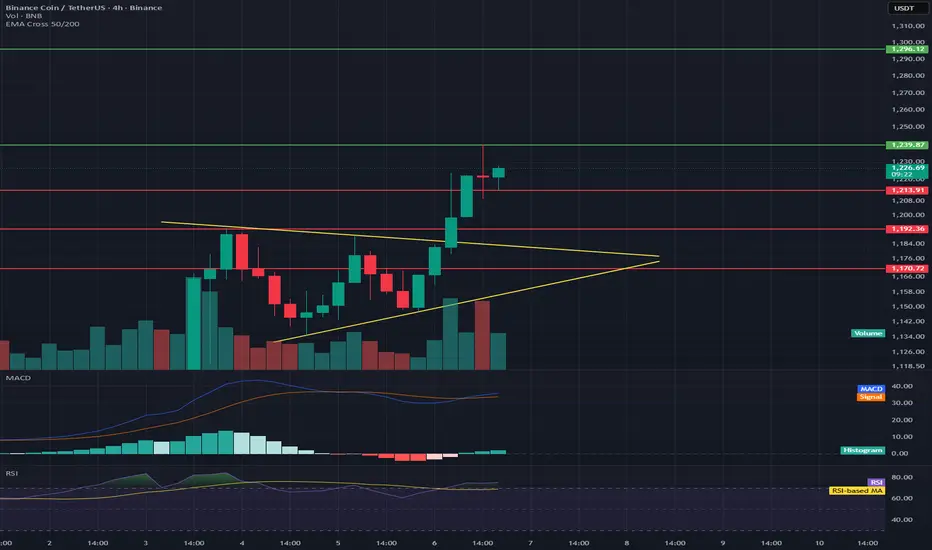
The chart shows a symmetrical triangle (yellow lines) from which a breakout occurred upwards—a classic signal of a continuing uptrend.
The price has broken above resistance at ~$1,210, which now acts as local support.
Current price: ~$1,226, following a dynamic breakout from the triangle.
📈 Key Levels
Support:
$1,210 — Retest after the breakout (important defensive level for bulls)
$1,193 — Previous local support in the triangle
$1,170 — Stronger support and lower boundary of the previous consolidation
Resistance:
$1,239 — Local resistance that has already been tested
$1,260–$1,265 — Next target upon breakout (equal movement or measuring the height of the triangle)
$1,300 — Psychological and technical resistance level
📊 Volume
The breakout was confirmed by a significant increase in volume, lending it credibility.
No sharp drop in volume after the breakout — the market remains in demand.
⚙️ MACD
The MACD is above the signal line and rising, confirming a bullish impulse.
The histogram is positive, but not excessively broad → momentum is healthy, but not overheated.
💪 RSI
RSI: ~75, which is slightly in the overbought zone.
It's worth watching for a short-term correction or retest of the $1,210 level before the uptrend becomes more established.
Disclaimer
The information and publications are not meant to be, and do not constitute, financial, investment, trading, or other types of advice or recommendations supplied or endorsed by TradingView. Read more in the Terms of Use.
Disclaimer
The information and publications are not meant to be, and do not constitute, financial, investment, trading, or other types of advice or recommendations supplied or endorsed by TradingView. Read more in the Terms of Use.