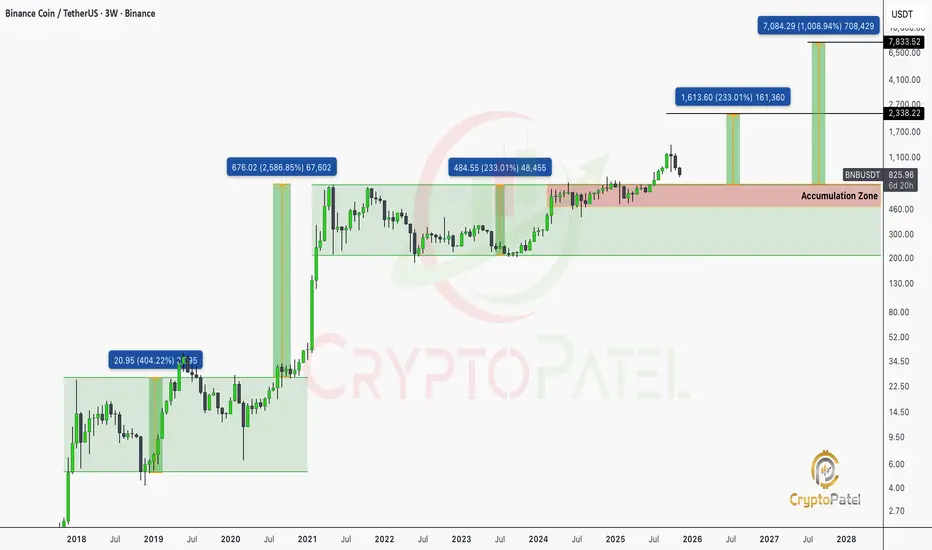
BNB/USDT 3-Week Chart Analysis: Is a Massive Breakout Coming?
Current Price: $827.05 (down 10.74%)
BNB is currently consolidating in a key Accumulation Zone between $700-$800, signaling institutional accumulation and balance.
Key Levels to Watch
Support Zones:
🔹 $484.55 – Critical demand from 2023 lows
🔹 $676.02 – Former ATH turned support
🔹 $700-$750 – Bottom of current accumulation
Resistance Targets:
🔹 $1,613 – First major upside
🔹 $2,338 – Next intermediate target
🔹 $7,084 – Long-term “moonshot” scenario
Volume & Structure Insights
🔹 2019 Breakout: Started the long-term uptrend
🔹 2021 Bull Run: Peak at $676, classic blow-off top
🔹 2024-2025 Accumulation: Renewed institutional interest
Bearish Risk
🔹 Failure to hold $700 → Retest $484 (-41%)
🔹 Breakdown below $484 → Bullish thesis invalid
NFA & DYOR
Twitter: twitter.com/CryptoPatel
Telegram: t.me/OfficialCryptoPatel
Instagram: instagram.com/cryptopatel?utm_medium=copy_link
Telegram: t.me/OfficialCryptoPatel
Instagram: instagram.com/cryptopatel?utm_medium=copy_link
Disclaimer
The information and publications are not meant to be, and do not constitute, financial, investment, trading, or other types of advice or recommendations supplied or endorsed by TradingView. Read more in the Terms of Use.