Volume footprint charts can be called as 'the eyes and ears' of the market. They truly reveal where the big orders are getting executed, the outcome of those orders and the possible future course of action.
To keep things simple, we may breakdown volume footprint charts with just two interpretations:
↳ Buyers may be interested in higher prices
Big orders and good bullish candle close or long wick at the bottom with higher close.
↳ Sellers may be interested in lower prices
Big orders and a bearish candle close or long wick at the top with lower close.
We can apply this interpretation to the key levels in the market to see which side is strong- buyers or sellers?
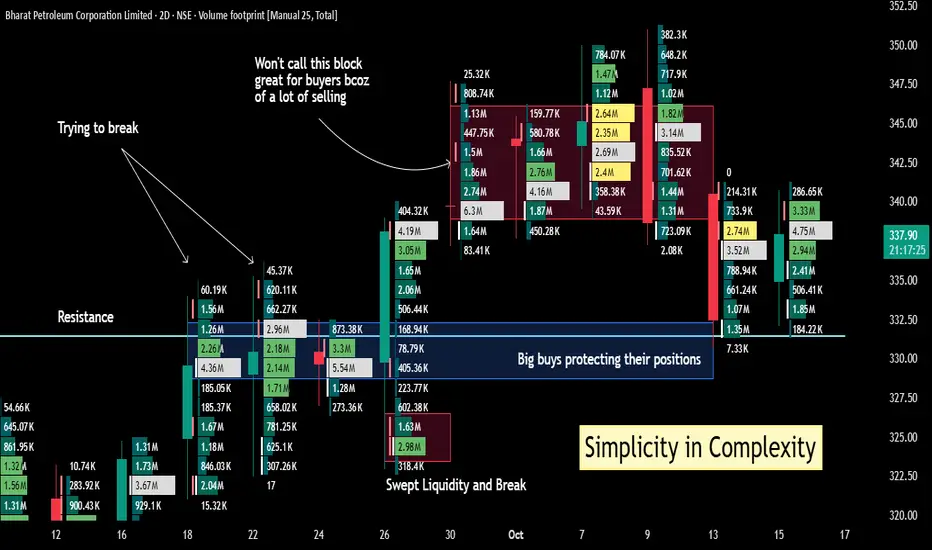
In this little backdrop, let's discuss the above chart.
It's a 2days chart of BPCL (I did that to accommodate more price action).
On a simple candlestick chart, you would see a breakout retest of 331 and the price is holding- giving a nice pullback trade if you missed the breakout trade.
However, footprint chart gives us more information about what is happening where.
First of all, the stock struggled near 331 resistance level even when the volumes were higher. Finally, it swept below a day low and broke out of resistance with good volumes.
Now what happened after the breakout of 331 blue resistance line?
Big-big orders were there but no good result. Hardly any candle with strong closing after the BO candle. This only means that sellers were active in the zone.
Then the price broke the 8-session low and notice big orders 2.74M and 3.52M at the break in the second last candle on the right. That's good for sellers, right?
But the big boys who were buying before or near the BO of 331 are now trying to protect their positions and hence the retest holds.
We have big orders in the same area- 3.33M, 4.75M and 2.94M shares traded though there is still one more day for this candle to close. We will get more information on it tomorrow.
If the price rallies from here, surely those who were selling in the 340-350 zone will try to protect their positions too and the ride may not be that smooth. More updates in the coming days.
This way footprint charts give more confidence if you are in a trade. It gives you a reason to enter or hold a trade.
Many times, keeping things simple works best in trading. Clear and straightforward analysis without extra indicators can give the good results.
But do you know one thing?
Every setup or edge works with a good position management and trade management. Otherwise, the best of the best trade may end up in a loss.
Trade safe, stay healthy.
Disclaimer: I don't have any position in this stock, and this is not a buy sell recommendation. This post is just for educational purpose.
To keep things simple, we may breakdown volume footprint charts with just two interpretations:
↳ Buyers may be interested in higher prices
Big orders and good bullish candle close or long wick at the bottom with higher close.
↳ Sellers may be interested in lower prices
Big orders and a bearish candle close or long wick at the top with lower close.
We can apply this interpretation to the key levels in the market to see which side is strong- buyers or sellers?
In this little backdrop, let's discuss the above chart.
It's a 2days chart of BPCL (I did that to accommodate more price action).
On a simple candlestick chart, you would see a breakout retest of 331 and the price is holding- giving a nice pullback trade if you missed the breakout trade.
However, footprint chart gives us more information about what is happening where.
First of all, the stock struggled near 331 resistance level even when the volumes were higher. Finally, it swept below a day low and broke out of resistance with good volumes.
Now what happened after the breakout of 331 blue resistance line?
Big-big orders were there but no good result. Hardly any candle with strong closing after the BO candle. This only means that sellers were active in the zone.
Then the price broke the 8-session low and notice big orders 2.74M and 3.52M at the break in the second last candle on the right. That's good for sellers, right?
But the big boys who were buying before or near the BO of 331 are now trying to protect their positions and hence the retest holds.
We have big orders in the same area- 3.33M, 4.75M and 2.94M shares traded though there is still one more day for this candle to close. We will get more information on it tomorrow.
If the price rallies from here, surely those who were selling in the 340-350 zone will try to protect their positions too and the ride may not be that smooth. More updates in the coming days.
This way footprint charts give more confidence if you are in a trade. It gives you a reason to enter or hold a trade.
Many times, keeping things simple works best in trading. Clear and straightforward analysis without extra indicators can give the good results.
But do you know one thing?
Every setup or edge works with a good position management and trade management. Otherwise, the best of the best trade may end up in a loss.
Trade safe, stay healthy.
Disclaimer: I don't have any position in this stock, and this is not a buy sell recommendation. This post is just for educational purpose.
Trade active
On the 75 minute chart there are two interesting points to notice-1. A red candle with big orders and a wick at the bottom with no continuation- absorption
2. Wicks coming with big order execution near 339- sellers getting active in the zone
A close above this zone will keep the buyers' hope high.
JJ Singh
Trader/Investor
Moderator, TradingView
🚀Join t.me/jjsingh_2020 ,
A Free Education channel
🚀Tweet at twitter.com/JaySingh_2020
Trader/Investor
Moderator, TradingView
🚀Join t.me/jjsingh_2020 ,
A Free Education channel
🚀Tweet at twitter.com/JaySingh_2020
Disclaimer
The information and publications are not meant to be, and do not constitute, financial, investment, trading, or other types of advice or recommendations supplied or endorsed by TradingView. Read more in the Terms of Use.