________________________________________
🍪 BRITANNIA INDUSTRIES LTD
Ticker: NSE: BRITANNIA | Sector: FMCG | CMP: 6,025.50 | Rating: ⚡️ Bullish Bias Emerging
________________________________________
🧭 Chart Summary
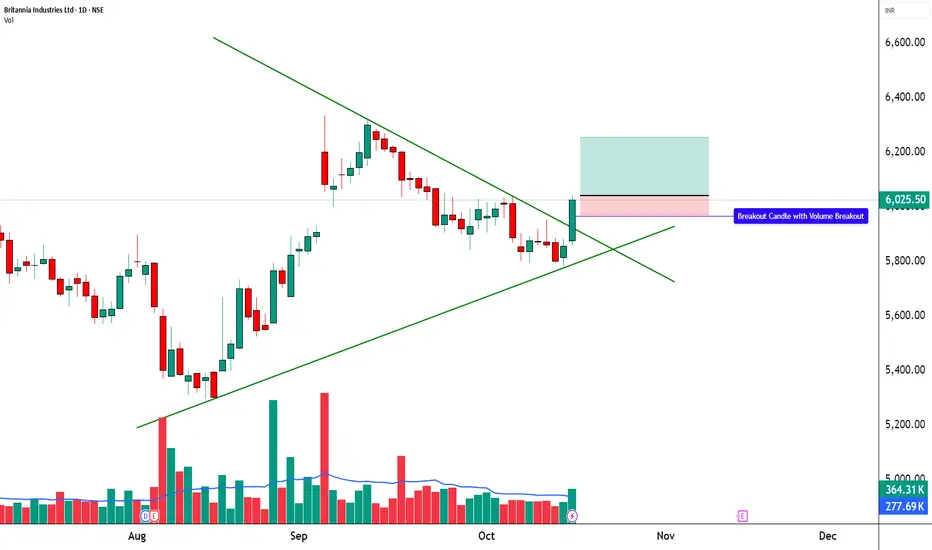
This chart of Britannia Industries Ltd (NSE) highlights a bullish breakout from a falling channel pattern after a prolonged period of controlled decline and consolidation.
The stock closed near 6,025.50, up +2.87%, forming a strong green candle backed by solid volume, signalling renewed buying strength.
The breakout above the channel’s upper trendline suggests a potential reversal of the short-term downtrend and the beginning of a new upward leg.
________________________________________
🟡 Technical Indicators Summary
The chart highlights bullish momentum supported by a strong bullish candle, indicating renewed buying interest.
A clear RSI breakout confirms strengthening momentum, while the Bollinger Band Squeeze-On Compression suggests volatility had tightened — often a precursor to a sharp directional move.
The recent liquidity sweep below key support appears to have trapped weak hands, fuelling this sharp rebound. Altogether, this setup reflects a bullish breakout zone where multiple indicators align in favour of buyers.
________________________________________
📊 Multi-Timeframe Trend View
The trend matrix shows 5m, 15m, 1H, 1W, and 1M all turning green (uptrend).
The daily is the only timeframe yet to flip, suggesting momentum is building and a daily trend alignment could soon confirm a broader upmove.
________________________________________
📈 Indicator Overview
RSI (56.9): Indicates moderate bullish strength — momentum is picking up.
MACD (-11.07): Still slightly negative but flattening, hinting at an upcoming bullish crossover.
CCI (27.3): Recovering from oversold territory, confirming a trend shift attempt.
Stochastic (94.2): Overbought zone — reflects strong short-term momentum, though minor pauses may occur.
________________________________________
🧩 Market Context
This pattern represents accumulation under resistance, commonly seen before strong breakouts in large-cap defensive stocks.
Given Britannia’s FMCG positioning, the move may also tie into a sector rotation play, as investors gravitate toward defensive sectors amid volatility in the broader markets.
________________________________________
💹 STWP Trade Analysis
Bullish Breakout Level: 6,041
Support Structure:
Intraday Support: 5,970 → Minor retest zone
Swing Support: 5,852 → Major trend-defining level
Intermediate Support: 5,776 → Key positional base
Key Levels (Subject to Daily Change):
Support: 5,909 / 5,792 / 5,726
Resistance: 6,091 / 6,157 / 6,274
________________________________________
🎓 STWP Learning
A falling channel breakout often signals that selling pressure has gradually weakened and smart money has started accumulating at lower levels.
When this pattern combines with rising volume and momentum indicators turning positive, it reflects a shift from distribution to accumulation.
Traders should note that confirmation above the breakout zone — ideally supported by volume — adds conviction to the move and reduces the risk of a false breakout.
________________________________________
⚠️ Disclosure & Disclaimer (SEBI-Compliant)
This content is created solely for educational and informational purposes to help readers understand technical analysis and market structure.
It does not constitute investment advice, research recommendation, or a solicitation to buy or sell any security.
The author is not a SEBI-registered investment adviser or research analyst.
All charts, patterns, and levels are based on personal study and historical data available from public sources such as TradingView and NSE India.
Position Status: No active position in BRITANNIA at the time of publication.
Trading and investing involve risk. Market movements can be unpredictable, and losses may exceed invested capital.
Readers are strongly advised to consult a SEBI-registered investment adviser before making any trading or investment decisions.
By engaging with this post, you acknowledge that you take full responsibility for your own trades, decisions, and outcomes.
________________________________________
💬 Found this useful?
🔼 Boost this post to support structured learning content.
✍️ Share your thoughts, questions, or observations — let’s grow together!
🔁 Share with learners and traders to promote responsible market education.
👉 “If you liked this breakdown, follow for more disciplined, educational trade setups.”
🚀 Stay Calm. Stay Clean. Trade With Patience.
Trade Smart | Learn Zones | Be Self-Reliant 📊
🍪 BRITANNIA INDUSTRIES LTD
Ticker: NSE: BRITANNIA | Sector: FMCG | CMP: 6,025.50 | Rating: ⚡️ Bullish Bias Emerging
________________________________________
🧭 Chart Summary
This chart of Britannia Industries Ltd (NSE) highlights a bullish breakout from a falling channel pattern after a prolonged period of controlled decline and consolidation.
The stock closed near 6,025.50, up +2.87%, forming a strong green candle backed by solid volume, signalling renewed buying strength.
The breakout above the channel’s upper trendline suggests a potential reversal of the short-term downtrend and the beginning of a new upward leg.
________________________________________
🟡 Technical Indicators Summary
The chart highlights bullish momentum supported by a strong bullish candle, indicating renewed buying interest.
A clear RSI breakout confirms strengthening momentum, while the Bollinger Band Squeeze-On Compression suggests volatility had tightened — often a precursor to a sharp directional move.
The recent liquidity sweep below key support appears to have trapped weak hands, fuelling this sharp rebound. Altogether, this setup reflects a bullish breakout zone where multiple indicators align in favour of buyers.
________________________________________
📊 Multi-Timeframe Trend View
The trend matrix shows 5m, 15m, 1H, 1W, and 1M all turning green (uptrend).
The daily is the only timeframe yet to flip, suggesting momentum is building and a daily trend alignment could soon confirm a broader upmove.
________________________________________
📈 Indicator Overview
RSI (56.9): Indicates moderate bullish strength — momentum is picking up.
MACD (-11.07): Still slightly negative but flattening, hinting at an upcoming bullish crossover.
CCI (27.3): Recovering from oversold territory, confirming a trend shift attempt.
Stochastic (94.2): Overbought zone — reflects strong short-term momentum, though minor pauses may occur.
________________________________________
🧩 Market Context
This pattern represents accumulation under resistance, commonly seen before strong breakouts in large-cap defensive stocks.
Given Britannia’s FMCG positioning, the move may also tie into a sector rotation play, as investors gravitate toward defensive sectors amid volatility in the broader markets.
________________________________________
💹 STWP Trade Analysis
Bullish Breakout Level: 6,041
Support Structure:
Intraday Support: 5,970 → Minor retest zone
Swing Support: 5,852 → Major trend-defining level
Intermediate Support: 5,776 → Key positional base
Key Levels (Subject to Daily Change):
Support: 5,909 / 5,792 / 5,726
Resistance: 6,091 / 6,157 / 6,274
________________________________________
🎓 STWP Learning
A falling channel breakout often signals that selling pressure has gradually weakened and smart money has started accumulating at lower levels.
When this pattern combines with rising volume and momentum indicators turning positive, it reflects a shift from distribution to accumulation.
Traders should note that confirmation above the breakout zone — ideally supported by volume — adds conviction to the move and reduces the risk of a false breakout.
________________________________________
⚠️ Disclosure & Disclaimer (SEBI-Compliant)
This content is created solely for educational and informational purposes to help readers understand technical analysis and market structure.
It does not constitute investment advice, research recommendation, or a solicitation to buy or sell any security.
The author is not a SEBI-registered investment adviser or research analyst.
All charts, patterns, and levels are based on personal study and historical data available from public sources such as TradingView and NSE India.
Position Status: No active position in BRITANNIA at the time of publication.
Trading and investing involve risk. Market movements can be unpredictable, and losses may exceed invested capital.
Readers are strongly advised to consult a SEBI-registered investment adviser before making any trading or investment decisions.
By engaging with this post, you acknowledge that you take full responsibility for your own trades, decisions, and outcomes.
________________________________________
💬 Found this useful?
🔼 Boost this post to support structured learning content.
✍️ Share your thoughts, questions, or observations — let’s grow together!
🔁 Share with learners and traders to promote responsible market education.
👉 “If you liked this breakdown, follow for more disciplined, educational trade setups.”
🚀 Stay Calm. Stay Clean. Trade With Patience.
Trade Smart | Learn Zones | Be Self-Reliant 📊
STWP | Mentor & Demand-Supply Specialist | Empowering traders through structured learning |
simpletradewithpatience.com
Community: chat.whatsapp.com/BEYz0tkqP0fJPBCWf59uel
wa.me/message/6IOPHGOXMGZ4N1
Educational Only
simpletradewithpatience.com
Community: chat.whatsapp.com/BEYz0tkqP0fJPBCWf59uel
wa.me/message/6IOPHGOXMGZ4N1
Educational Only
Disclaimer
The information and publications are not meant to be, and do not constitute, financial, investment, trading, or other types of advice or recommendations supplied or endorsed by TradingView. Read more in the Terms of Use.