💡 Strategy Description (Study Idea):
This study highlights a bullish reversal setup developing on the weekly timeframe for Bombay Super Hybrid Seeds Ltd (NSE).
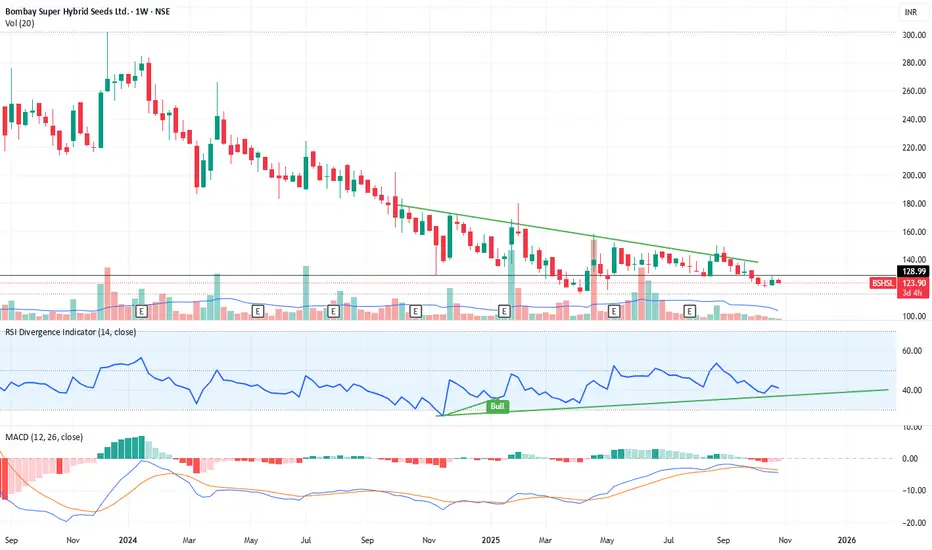
The stock has been in a prolonged downtrend, forming lower highs under a descending trendline, but momentum indicators suggest a possible bottoming phase.
Key Observations:
RSI Bullish Divergence:
Price is making lower lows while RSI is forming higher lows — indicating weakening selling pressure.
RSI is currently near the 40 zone, suggesting limited downside risk and potential for an upward move.
MACD Convergence:
The MACD histogram shows fading bearish momentum.
A bullish crossover between the MACD and signal line could confirm a reversal.
Trendline Resistance Zone:
The descending resistance line lies around ₹135–₹140.
A breakout and close above this zone on strong volume may trigger a trend reversal.
Volume Behavior:
Gradual accumulation observed at lower levels.
A volume spike during breakout would strengthen the bullish case.
📝 Notes:
This study highlights a bullish reversal setup developing on the weekly timeframe for Bombay Super Hybrid Seeds Ltd (NSE).
The stock has been in a prolonged downtrend, forming lower highs under a descending trendline, but momentum indicators suggest a possible bottoming phase.
Key Observations:
RSI Bullish Divergence:
Price is making lower lows while RSI is forming higher lows — indicating weakening selling pressure.
RSI is currently near the 40 zone, suggesting limited downside risk and potential for an upward move.
MACD Convergence:
The MACD histogram shows fading bearish momentum.
A bullish crossover between the MACD and signal line could confirm a reversal.
Trendline Resistance Zone:
The descending resistance line lies around ₹135–₹140.
A breakout and close above this zone on strong volume may trigger a trend reversal.
Volume Behavior:
Gradual accumulation observed at lower levels.
A volume spike during breakout would strengthen the bullish case.
📝 Notes:
- This study is based on technical divergence and trend reversal principles.
- Always wait for breakout confirmation with volume before taking directional exposure.
- Ideal for positional/swing traders monitoring early trend reversals.
- The chart currently indicates a base formation; premature entries below ₹130 could face short-term volatility.
- Not financial advice — purely for educational and analytical study purposes.
Disclaimer
The information and publications are not meant to be, and do not constitute, financial, investment, trading, or other types of advice or recommendations supplied or endorsed by TradingView. Read more in the Terms of Use.
Disclaimer
The information and publications are not meant to be, and do not constitute, financial, investment, trading, or other types of advice or recommendations supplied or endorsed by TradingView. Read more in the Terms of Use.