Hello
It's a Bitcoin Guide.
If you "follow"
You can receive real-time movement paths and comment notifications on major sections.
If my analysis was helpful,
Please click the booster button at the bottom.

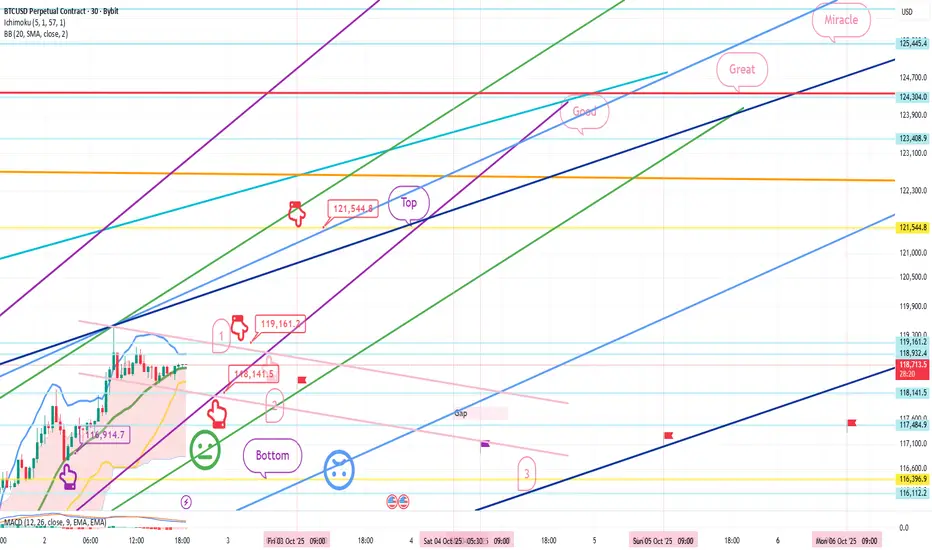
This is a 30-minute Bitcoin chart.
The bottom left shows yesterday's long position re-entry point, $116,914.7, indicated by a purple finger.
We will continue with the trend-following strategy.
*Red finger movement path:
Long position strategy
1. $118,668.2 long position entry point / Stop loss price if the green support line is broken
2. $119,161.2 long position primary target -> Target prices in order from the top to the miracle level
If the strategy is successful, the first section is the long position re-entry point,
and a new high is reached after the great breakout.
The second section is the final long position entry point.
If the green support line is maintained until the second section,
it will become an upward sideways market.
If the light blue support line holds through the weekend and next week,
it could continue to rise as it's a mid-term uptrend line.
Please keep this in mind.
Bottom -> I've left up to three sections.
You can check the prices of the major support and resistance lines above and below the section I've left or by dragging.
Please use my analysis as a reference only.
I hope you operate safely, with a principled trading strategy and stop-loss orders in place.
Have a nice holiday until next Friday.
I'll be back on Friday.
Thank you.
It's a Bitcoin Guide.
If you "follow"
You can receive real-time movement paths and comment notifications on major sections.
If my analysis was helpful,
Please click the booster button at the bottom.
This is a 30-minute Bitcoin chart.
The bottom left shows yesterday's long position re-entry point, $116,914.7, indicated by a purple finger.
We will continue with the trend-following strategy.
*Red finger movement path:
Long position strategy
1. $118,668.2 long position entry point / Stop loss price if the green support line is broken
2. $119,161.2 long position primary target -> Target prices in order from the top to the miracle level
If the strategy is successful, the first section is the long position re-entry point,
and a new high is reached after the great breakout.
The second section is the final long position entry point.
If the green support line is maintained until the second section,
it will become an upward sideways market.
If the light blue support line holds through the weekend and next week,
it could continue to rise as it's a mid-term uptrend line.
Please keep this in mind.
Bottom -> I've left up to three sections.
You can check the prices of the major support and resistance lines above and below the section I've left or by dragging.
Please use my analysis as a reference only.
I hope you operate safely, with a principled trading strategy and stop-loss orders in place.
Have a nice holiday until next Friday.
I'll be back on Friday.
Thank you.
Order cancelled
Hello,It's a Bitcoin Guide.
I'll check the movement after writing the analysis on October 2nd.
This is a 30-minute Bitcoin chart.
At the bottom left, the purple finger indicates the long position re-entry zone at $116,914.7, and the strategy is connected to that zone.
In the red finger long position strategy,
the long position entry zone is $118,141.5.
Without touching the entry zone,
it rose strongly within the purple support line and closed.
After touching the long position re-entry zone (zone 1) at the top,
the upper target price, starting from the top, reached the Miracle level, and
the new high was completed.
Since the entry zone was not touched, the strategy was canceled.
This is a 4-hour Bitcoin chart.
Since I haven't written an analysis post in two weeks,
I'll briefly summarize the key areas up until recently.
Before the holidays, the price continued to rise without touching the entry point,
and then reached a new high near the Miracle level.
This area became a double top at the mid-term point,
and after the new high, coupled with the Nasdaq crash,
a strong decline occurred.
After a gradual rise without an entry point,
a particularly irritating move finally occurred.
This can be easily countered with trading techniques,
so I believe long-time followers have operated without any damage.
From left to right:
October 1st: Purple finger, re-entered long position at $116,914.7,
touched the Miracle level -> closed after reaching a double top.
At this time, a Gap9 level was created,
and a pullback was completed last week.
On October 10th, it moved sideways,
and then coupled with the Nasdaq, triggering a strong correction.
After completing a pullback at the bottom, the Gap8 level
rebounded,
and the lower tail rebounded to $103,171.5.
A new Gap10 level was created,
and a pullback has not yet occurred.
This is a brief summary of the information provided during my absence.
My long-term perspective remains the same.
It's raining heavily, so drive safely.
And keep up the good work today.
Thank you.
Note
Hello,It's a Bitcoin Guide.
I'll check the movement after writing the analysis on October 13th.
This is a 30-minute chart for the Nasdaq.
Key sectors are marked with black fingers.
In the red finger long position strategy,
short at the purple finger (section 1) above ->
long position switch at the red finger (section 24,634.5).
After a rebound just short of the target price of 24,874.3 above,
it failed to break through the orange resistance line.
The correction is currently underway to the bottom.
There remains a gap retracement below,
and it will be important to see what kind of movement it will produce.
This is a 30-minute chart for Bitcoin.
Key sectors are marked with black fingers.
In the red finger long position strategy,
it did not reach the long position entry point at $113,193.7,
but touched the Gap 8 point of the purple parallel line support line,
and then touched the target price of $115,760.4, ending in an upward sideways movement.
Since the entry point was not touched,
the strategy was canceled.
A new daily candlestick formed today,
and as it detoured, a correction is underway from yesterday's long position entry point of 113.1K,
> Bottom,
> Level 2.
With $110,769 remaining at the bottom,
the Nasdaq movement appears to be crucial.
If the Nasdaq fails to show a Gap retracement,
it could connect with the weekly MACD dead cross.
If additional corrections occur this week,
it may take some time for Bitcoin to reach a new all-time high.
I hope you continue to operate safely while practicing principle trading for the rest of your time.
Thank you.
Note
Hello,It's a Bitcoin Guide.
I'll check the movement after writing the analysis on October 14th.
This is a 30-minute chart for the Nasdaq.
Key areas are marked with black fingers.
In the red finger long position strategy,
24,354.4 points at the bottom -> Gap area
Long position completed.
Target price of 24,735.2 points at the top.
A clean, perfect completion.
Re-entered the long position in section 1 -> near the top of the red resistance line
A rebound is in progress.
This is a 30-minute chart for Bitcoin.
Key areas are marked with black fingers.
Based on the Nasdaq Gap point,
the sky blue finger short->long switching strategy
first touched the $110,731 long position switching level at the bottom,
then reached the $113,061.6 short position entry level, and closed the sideways trading range.
After that, the price continued to move sideways without any significant movement.
At first glance, this may seem perfect,
but since the short position wasn't touched first,
the strategy has been canceled.
Bitcoin is losing direction,
so I'll take a closer look.
Thank you.
Note
Hello,It's a Bitcoin Guide.
I'll check the movement after writing the analysis on October 15th.
This is a 30-minute chart for the Nasdaq.
Key areas are marked with black fingers.
In the red finger long position strategy,
we first touch the top target area at the top, bypass it,
and then touch the second area.
The long position entry area (gap) is 24,659.7.
We closed the market sideways without breaking the green support line.
A new daily candlestick was created and reached the top area.
The Nasdaq first touched the upper Bollinger Band,
and the uptrend continues.
This is a 30-minute chart for Bitcoin.
Key areas are marked with black fingers.
In the red finger long position strategy,
the price immediately fell without touching the first purple finger at the top,
so a final long position was placed at $110,801.7 in the second section.
After entering the long position, it ended in a sharp sideways movement.
The green support line is being damaged.
With the condition for maintaining the long position in the second section,
we will proceed with the strategy as an active strategy.
Let's continue with today's strategy.
Thank you.
Note
Hello,It's a Bitcoin Guide.
I'll check the movement since writing the analysis on October 16th.
This is the Nasdaq 30-minute chart.
The main sections are marked with black fingers.
The red fingers represent the long position strategy.
In the first section, marked with a purple finger at the top, a short position was entered at the rising wave check zone.
The long position was switched to the lower section. It touched the 24,739.7 level and then closed after falling to the bottom.
With the creation of additional daily candles today,
a strong correction is continuing.
It broke through the deep blue support line at the bottom,
and was influenced by the MACD dead cross on the weekly chart.
This is the Bitcoin 30-minute chart. I've marked the key areas with black fingers.
The purple finger on the left, in the analysis article on the 15th, connects the strategy to the long position entry point of $110,801.7. The red finger is a long position strategy.
After entering a short position at the first purple finger point above,
we cut our losses at the maximum of two long position switching points,
when the price broke through the purple support line.
The price closed at the bottom.
A new daily candlestick was created today,
and it is now in a forced decline, perfectly coupled with the Nasdaq.
I explained yesterday that
after breaking through the green support line, the downside is open
and could be linked to a medium-term decline,
so it's not a good idea for a long position.
The movement through this weekend looks very important,
so you should focus.
Hold on today!
Thank you.
*비트코인가이드 공식텔레그램 Telegram
t.me/BTG_Group
*빙엑스 BingX 50%DC+$5,000 (총1회수수료)
bingx.com/invite/YBM3A4
*바이비트 Bybit 20%DC+$5,020
partner.bybit.com/b/Bitcoin_Guide
*앞으로는 하단의 네이버카페에서만 활동합니다.
cafe.naver.com/loanlife82
t.me/BTG_Group
*빙엑스 BingX 50%DC+$5,000 (총1회수수료)
bingx.com/invite/YBM3A4
*바이비트 Bybit 20%DC+$5,020
partner.bybit.com/b/Bitcoin_Guide
*앞으로는 하단의 네이버카페에서만 활동합니다.
cafe.naver.com/loanlife82
Related publications
Disclaimer
The information and publications are not meant to be, and do not constitute, financial, investment, trading, or other types of advice or recommendations supplied or endorsed by TradingView. Read more in the Terms of Use.