1. Market Structure
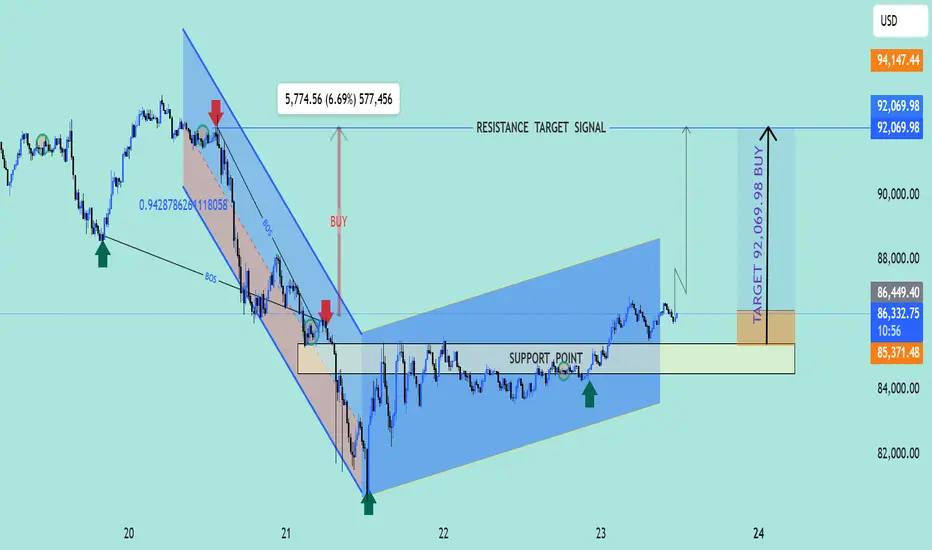
The chart shows that the market was previously in a downtrend, but price has now created a bullish structure shift.
This shift is confirmed by a Break of Structure (BOS) to the upside, meaning buyers have taken control.
---
2. Support Zone
Price reacted strongly from the support zone around 85,371 – 86,242.
This area acted as a demand zone, showing:
strong buying interest
repeated rejections of lower prices
possible accumulation before an upward move
---
3. Bullish Signals
Several elements confirm a bullish direction:
BOS upward (break of previous highs)
formation of higher lows
movement into an ascending channel
strong buying wicks from support
These signs indicate that the market is preparing for a continuation to the upside.
---
4. Target Projection
The chart marks a major target at 92,069.98 USD.
This is likely based on:
past resistance levels
a measured move from the breakout
liquidity sitting above previous highs
This makes 92K a logical take-profit level.
---
5. Risk Level
If the price falls below 85,000, the bullish structure becomes invalid.
This would suggest:
loss of support
possible return to bearish control
breakdown from the current pattern
This level is suitable as a stop-loss for traders.
---
6. Summary
Trend has shifted from bearish to bullish
Strong reaction at support
Confirmed upward BOS
Price is showing healthy continuation signals
Target is 92K
Risk below 85K
 EDUUSDT_1EEDEC.USD
  SPXWETH_52C77B.USD
  MLTWETH_9B3DF8.USD
  VOWUSDT_1E4976.USD VOWWETH_7FDEB4.USD
  WPOKTWETH_A7FD8F.USD
  CUBEWETH_F6C359.USD
  BANANAWETH_43DE43.USD
  SPECTREWETH_8A6D95.USD
The chart shows that the market was previously in a downtrend, but price has now created a bullish structure shift.
This shift is confirmed by a Break of Structure (BOS) to the upside, meaning buyers have taken control.
---
2. Support Zone
Price reacted strongly from the support zone around 85,371 – 86,242.
This area acted as a demand zone, showing:
strong buying interest
repeated rejections of lower prices
possible accumulation before an upward move
---
3. Bullish Signals
Several elements confirm a bullish direction:
BOS upward (break of previous highs)
formation of higher lows
movement into an ascending channel
strong buying wicks from support
These signs indicate that the market is preparing for a continuation to the upside.
---
4. Target Projection
The chart marks a major target at 92,069.98 USD.
This is likely based on:
past resistance levels
a measured move from the breakout
liquidity sitting above previous highs
This makes 92K a logical take-profit level.
---
5. Risk Level
If the price falls below 85,000, the bullish structure becomes invalid.
This would suggest:
loss of support
possible return to bearish control
breakdown from the current pattern
This level is suitable as a stop-loss for traders.
---
6. Summary
Trend has shifted from bearish to bullish
Strong reaction at support
Confirmed upward BOS
Price is showing healthy continuation signals
Target is 92K
Risk below 85K
JOIN MY TELEGRAM CHANNEL
t.me/StellarMarketAnalysis
JOIN MY RECOMMENTED BROKER REFFREL LINK
⤵️one.exnesstrack.net/a/uvd1etcgg1
PARTNER CODE⤵️
uvd1etcgg1
t.me/StellarMarketAnalysis
JOIN MY RECOMMENTED BROKER REFFREL LINK
⤵️one.exnesstrack.net/a/uvd1etcgg1
PARTNER CODE⤵️
uvd1etcgg1
Disclaimer
The information and publications are not meant to be, and do not constitute, financial, investment, trading, or other types of advice or recommendations supplied or endorsed by TradingView. Read more in the Terms of Use.