Parameter Data
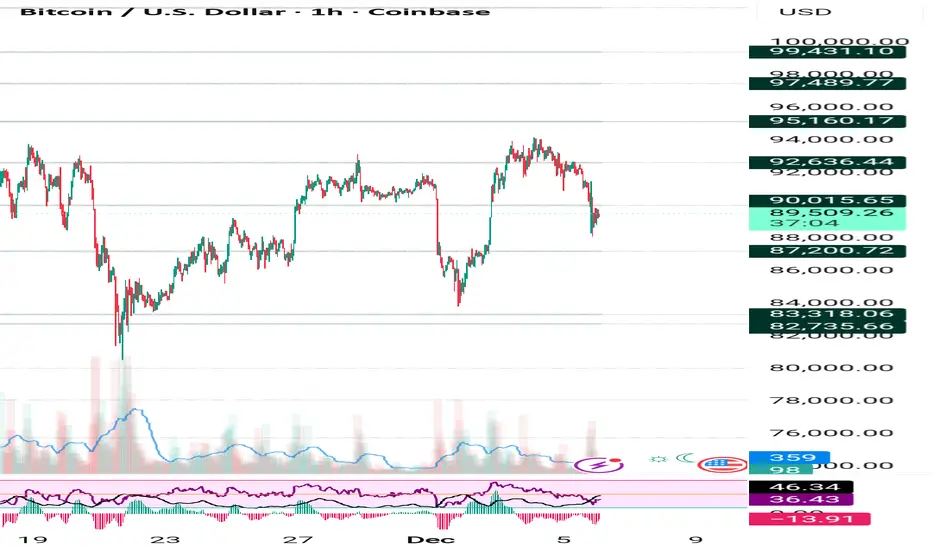
Asset Name Bitcoin: $89,461.64 [ 🟥 -2.91% ] (LTP: Dec 5, 2025, 21:20 UTC)
Price Movement Consolidation near support. Upside targets are [R1: $91,900] and [R2: $94,700]. Downside breakdown below [Alternate Scenario breaking point: $88,000] targets [S1: $85,000] and [S2: $82,000].
Current Trade 🟨 Neutral/Range / Long on bounce from $88,000, Short on failure at $93,500 / SL: $87,800 (Long), $93,700 (Short)
Risk Reward (R:R) 🟨 1 : 1.5 [ breakout above $94,700 & Breakdown below $88,000 ]
Confidence 🟨 20/30 (66.67%) (Neutral, waiting for structural confirmation of the next move.)
Probability 🟨 55% (Slight tilt toward Bullish continuation after consolidation.)
Market Phase 🟨 Consolidation/Contraction (Tight horizontal range between $88,000 and $93,000.)
DEMA Levels 🟨 Neutral/Bullish (Price is near 20-DEMA, but above 50-DEMA; mixed short-term signal.)
Supports 🟩 S1: $88,000 (Immediate Swing Low), 🟩 S2: $85,000 (Major Liquidation Support/Pivot), 🟩 S3: $80,000 (Strong Psychological/Annual Low Defense).
Resistances 🟥 R1: $91,900 (Intraday Pivot/Range Top), 🟥 R2: $94,700 (Key Weekly Resistance/Breakout Point), 🟥 R3: $100,000 (Major Psychological Barrier).
SMC Structure 🟨 Market Structure Shift (MSS) Awaited. The recent sharp drop was a liquidity sweep. A clean Break of Structure (BOS) above $94,700 is needed to confirm a continuation of the higher timeframe Bullish Order Flow.
Trap/Liquidity Zones 🟥 Liquidity Pool: Sell-Side Liquidity below $85,000. Liquidity Target: Buy-Side Liquidity above $95,000.
Max Pain 🟨 N/A (Futures data not applied.)
ADX/RSI/DMI 🟨 RSI (14): 50 (Neutral), ADX (14): 15 (Weak trend, confirming consolidation.)
Market Depth 🟨 N/A (Weekend data; Depth N/A.)
Volatility 🟨 Moderate (Volatility is compressed, typical of range trading.)
Source Ledger 🟩 Verified (Crypto 24/7): Price feed from Friday, Dec 5, 2025, 21:20 UTC.
OI 🟥 Down / Price Down (Open Interest dropped significantly on Friday, mostly from long liquidations.)
PCR 🟨 N/A (Data not directly available.)
VWAP 🟨 N/A (VWAP data not available.)
Turnover 🟨 Moderate (Lower weekend volume expected.)
Harmonic Pattern 🟨 Symmetrical Triangle (Forming on the 4H chart, indicating compression before a volatile move.)
IV/RV 🟨 Moderate IV (Implied Volatility is contracting, anticipating a directional break.)
Options Skew 🟨 Neutral Skew (Risk is currently balanced between Call and Put demand.)
Vanna/Charm 🟨 N/A (Neutral.)
Block Trades 🟩 Accumulation observed near the $88,000-$89,000 range, suggesting institutional defense.
COT Positioning 🟩 Net Long (Institutional funds remain net long on CME Bitcoin futures, despite the pullback.)
Cross-Asset Correlation 🟩 High Positive with Nasdaq 100 (NDX); High Inverse with USD Index (DXY).
ETF Rotation 🟩 Inflows (Spot Bitcoin ETFs continue to see net inflows on most days, supporting the long-term base.)
Sentiment Index 🟨 60 (Greed). Sentiment has pulled back from Extreme Greed but remains bullish.
OFI 🟨 Neutral (Order Flow indicates balanced buying and selling pressure in the current range.)
Delta 🟨 Cumulative Delta: Slightly Negative (Sellers had a slight edge during the sharp drop.)
VWAP Bands 🟨 N/A (VWAP band data not available.)
Rotation Metrics 🟩 Leading Indicator (Bitcoin is expected to outperform risk assets if the Fed cuts rates.)
Data Triangulation 🟩 Verified (Technical levels confirmed across multiple analyst reports; consolidation phase is the consensus.)
Disclaimer
The information and publications are not meant to be, and do not constitute, financial, investment, trading, or other types of advice or recommendations supplied or endorsed by TradingView. Read more in the Terms of Use.
Disclaimer
The information and publications are not meant to be, and do not constitute, financial, investment, trading, or other types of advice or recommendations supplied or endorsed by TradingView. Read more in the Terms of Use.