For the last 3 weeks, Bitcoin has been in a tight range and each candle has been small body and long wicks, showing indecision and uncertainty
https://www.tradingview.com/x/SLulN4BV/
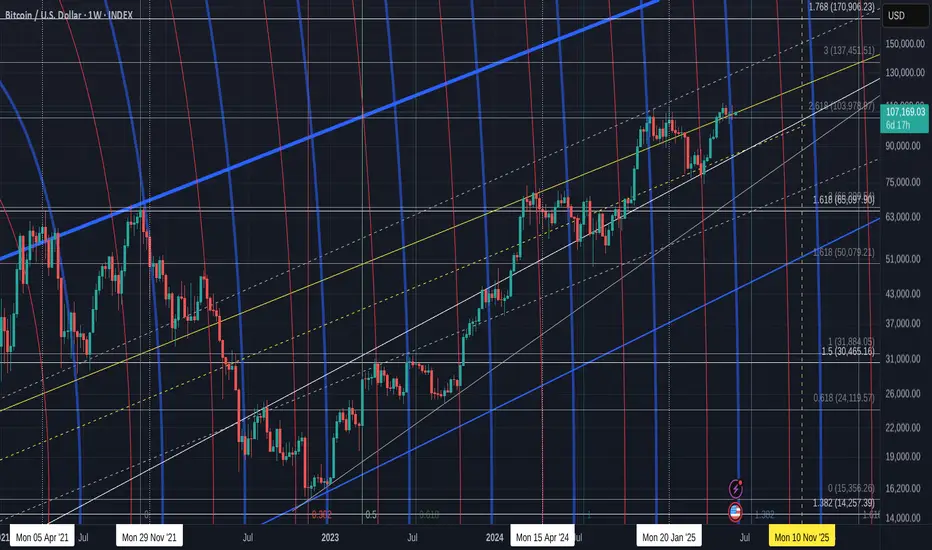
This close up chart shows how these 3 weekly candles have occurred at the intersection of a Fib circle (blue) and This alone could explain these "wicky" candles... The Bulls have been fighting hard to keep PA up and to not let it slide down that fib circle, as is normal the majority of the time.
.
We shall find out this week because, now, there is not a lot to stop the Bulls trying harder.
The FED will let us know the decision on interest rates on 18th.
This will likely cause a reaction in markets and I think we are most likely to see Rates remain static.
PA is currently on Support and remains above the 2.618 Fib extension.
All is Good
The MVRV (Green) and Z Score (yellow) can be complicated to fully understand but what is important to understand here is how the Yellow Z Score is still above the Green MVRV. this remains Bullish. We should notice how Both are falling and we wait for them to cross back over that falling line of resistance.
Currently, This chart shows us that Bitcoin has a slightly undervalued price. The higher we go, the more Oversold, Undervalued/ the top is the opposite, overbought / over valued.
The MACD is showing us a s;light levelling off
https://www.tradingview.com/x/cvUequ2m/
For me, I think this is similar to what we saw in the end of 2024. The MACD may go back down to the Red signal line and bounce....Again, we have to wait and see. Remember, that just because MACD drops, BTC PA does not always follow. We can range across instead
Over all, I am still Bullish long term but we may see some continued uncertainty in this market. The FED decision later this week will have an impact for sure
Bitcoin remains strong though but should circumstances allow, we could revisit 90K on that trend line below current position. I am not to sure this will happen but a good idea t be ready if it does.
What is certain is how PA has never really been in such a "soft" controlled action.
The nearest we have is way back in 2016 to 2016.
At this time period, we also saw BTC PA rise in a slow steady rise, no sharp pushes higher till the final push to ATH.
Currently, we seem to have repeated a similar Acton though. now, for longer
So, we wait and we will find out..
https://www.tradingview.com/x/SLulN4BV/
This close up chart shows how these 3 weekly candles have occurred at the intersection of a Fib circle (blue) and This alone could explain these "wicky" candles... The Bulls have been fighting hard to keep PA up and to not let it slide down that fib circle, as is normal the majority of the time.
.
We shall find out this week because, now, there is not a lot to stop the Bulls trying harder.
The FED will let us know the decision on interest rates on 18th.
This will likely cause a reaction in markets and I think we are most likely to see Rates remain static.
PA is currently on Support and remains above the 2.618 Fib extension.
All is Good
The MVRV (Green) and Z Score (yellow) can be complicated to fully understand but what is important to understand here is how the Yellow Z Score is still above the Green MVRV. this remains Bullish. We should notice how Both are falling and we wait for them to cross back over that falling line of resistance.
Currently, This chart shows us that Bitcoin has a slightly undervalued price. The higher we go, the more Oversold, Undervalued/ the top is the opposite, overbought / over valued.
The MACD is showing us a s;light levelling off
https://www.tradingview.com/x/cvUequ2m/
For me, I think this is similar to what we saw in the end of 2024. The MACD may go back down to the Red signal line and bounce....Again, we have to wait and see. Remember, that just because MACD drops, BTC PA does not always follow. We can range across instead
Over all, I am still Bullish long term but we may see some continued uncertainty in this market. The FED decision later this week will have an impact for sure
Bitcoin remains strong though but should circumstances allow, we could revisit 90K on that trend line below current position. I am not to sure this will happen but a good idea t be ready if it does.
What is certain is how PA has never really been in such a "soft" controlled action.
The nearest we have is way back in 2016 to 2016.
At this time period, we also saw BTC PA rise in a slow steady rise, no sharp pushes higher till the final push to ATH.
Currently, we seem to have repeated a similar Acton though. now, for longer
So, we wait and we will find out..
Nothing to be taken as Financial advice.
I will always say
"Only invest what you can afford to loose. When you are ready, take out your original investment. This way, it is only your profit that is at risk"
THAT is Financial advice
I will always say
"Only invest what you can afford to loose. When you are ready, take out your original investment. This way, it is only your profit that is at risk"
THAT is Financial advice
Disclaimer
The information and publications are not meant to be, and do not constitute, financial, investment, trading, or other types of advice or recommendations supplied or endorsed by TradingView. Read more in the Terms of Use.