BTCUSDT Weekly Chart – Full Analysis
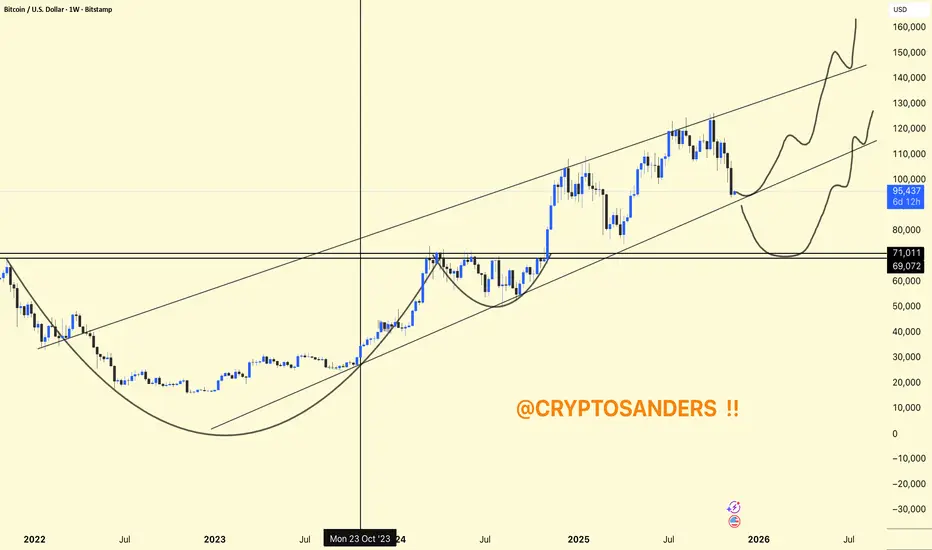
Bitcoin is trading within a long-term rising channel, maintaining higher highs and higher lows over multiple years.
Recent Structure: After a powerful uptrend, BTC is currently retesting the midline of the channel as support, which aligns closely with historical breakout levels.
Chart Patterns: Two notable cup-and-handle formations are marked, suggesting strong accumulation phases followed by aggressive rallies. Both patterns played out bullishly with price surges.
Immediate support is in the $90,000–$95,000 region (lower channel line). If lost, deeper support lies around $71,000–$69,000.
BTC holds this channel and midline; the upside path targets $140,000–$160,000 based on the channel ceiling.
A breakdown would likely cause a deeper retrace, with potential demand return at lower horizontal supports.
Short-term volatility is likely, but as long as the major uptrend and channel structure remain intact, BTC is poised for higher targets into 2026.
BTC's weekly chart is still constructive, with a bullish long-term structure, but critical support is being tested. Holding this range could set up for a continuation to new all-time highs, while a breakdown would mean a deeper consolidation first.
DYOR | NFA
Related publications
Disclaimer
The information and publications are not meant to be, and do not constitute, financial, investment, trading, or other types of advice or recommendations supplied or endorsed by TradingView. Read more in the Terms of Use.
Related publications
Disclaimer
The information and publications are not meant to be, and do not constitute, financial, investment, trading, or other types of advice or recommendations supplied or endorsed by TradingView. Read more in the Terms of Use.