BITCOIN - STAY OUT OF MARKET RIGHT NOW ?

Hi guys, XUANHAIMMOER is here with all you update today.
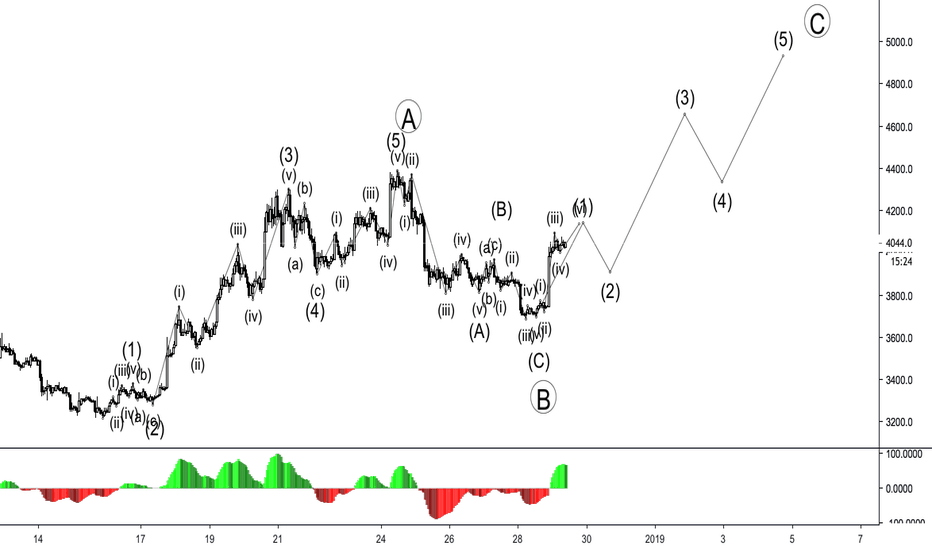
So today we have some different with many time before that I will declare some criteria for all you instead of using Elliot analysis for next time until BTC have clearly signal.
In last day we all see that BTC have been dumped from 40xx$ in Bitfinex and I also not surprise with this action because many time we have been felt down from this resistance zone.
But the most important thing is the volume in below. Do you see that ? That is problem. Day by day and we see the volume is lower and lower. That mean the market is not clearly for claim that it want to go up or down. We may wait for one day when the volume of market come back with break out up or down this triangle pattern.
The current resistance line and the current support line built a triangle pattern. The job of us right now is stay our market and put stop loss if you buy in my suggestion buy zone last time in 37xx - 38xx$ and keep holding. Sell when the price break down stop loss level I put in above.
WMA49 and WMA105 also be calculated with volume but may we have sideway and unclearly signal for this time.
We will wait the market for next several day and enter with safer entry position than enter right now is very risk for both LONG and SHORT position.
So which signal that we can believe is waiting for the price break up or down triangle pattern with big volume to confirm and I will update when it success in TradingView with next analysis for all you.
Both RSI and DMI as well as MACD indicator also give us triangle pattern with unclearly signal.
If we break down stop loss level so we may see 35xx$ support zone in Bitfinex again.
STAY OUT MARKET UNTIL WE HAVE CLEARLY SIGNAL AND I WILL PUBLIC NEW ANALYSIS FOR ALL YOU \u2028\u2028LOVE ALL <3 <3 <3 ~~~ LIKE THIS POST FOR SUPPORT ME !
Note
BTC go exactly like 15 minutes chart I updated in above !Note
Last analysis in 24 Dec BITCOIN - ELLIOT ANALYSIS METHOD - WHAT HAPPEN NEXT ?

Last analysis in 25 Dec
BITCOIN - Which strategy and trend for Bitcoin right now ?

Last analysis in 27 Dec
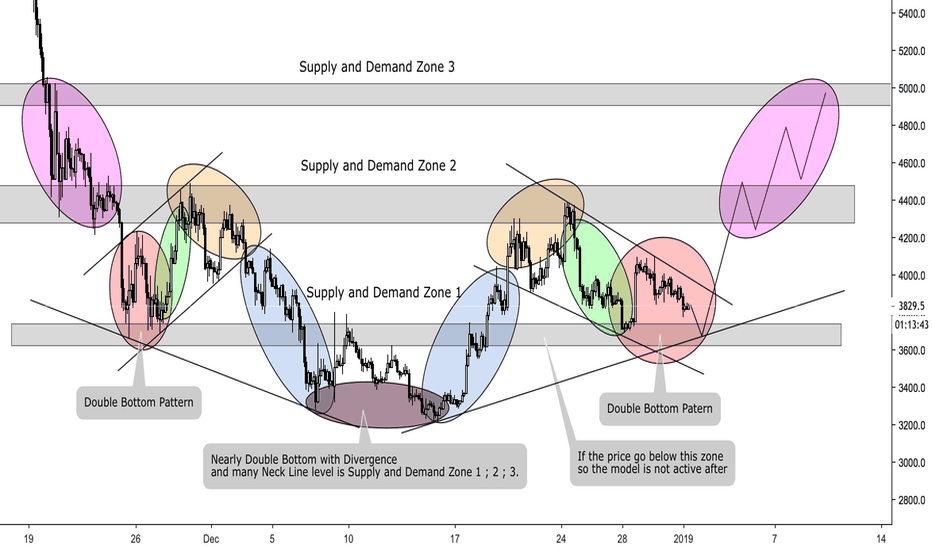
THE SCENARIO OF BITCOIN BOTTOM ZONE IN 2019

Last analysis in 28 Dec
BITCOIN - BOUNCE UP AREA - ELLIOT

Last analysis in 29 Dec
BITCOIN - TARGET WITH ELLIOT IN MIDDLE TERM

Last analysis in 30 Dec
BITCOIN - SIMULATOR MODEL - ELLIOT TARGET IN MIDDLE TERM

Last analysis in 31 Dec
BITCOIN - ABCD PATTERN - 4900 $ TARGET ?

Last analysis in 1 Jan
BITCOIN - SIMPLE COMPARING - HAPPY NEW YEAR 2019

Last analysis in 2 Jan
BITCOIN - ELLIOT ANALYSIS KEEP CONTINUING

Last analysis in 3 Jan
BITCOIN - RISING WEDGE PATTERN - NEW BOTTOM ZONE 2019 ?

Last analysis in 4 Jan
BITCOIN - WHICH STRATEGY FOR THIS TIME ?

Last analysis in 5 Jan
BITCOIN - Good support has been built - Time for bull coming ?

Note
Our analysis is working in nearly 10 days with exactly going each post analysis everyday.The price break up triangle pattern !
Disclaimer
The information and publications are not meant to be, and do not constitute, financial, investment, trading, or other types of advice or recommendations supplied or endorsed by TradingView. Read more in the Terms of Use.
Disclaimer
The information and publications are not meant to be, and do not constitute, financial, investment, trading, or other types of advice or recommendations supplied or endorsed by TradingView. Read more in the Terms of Use.

